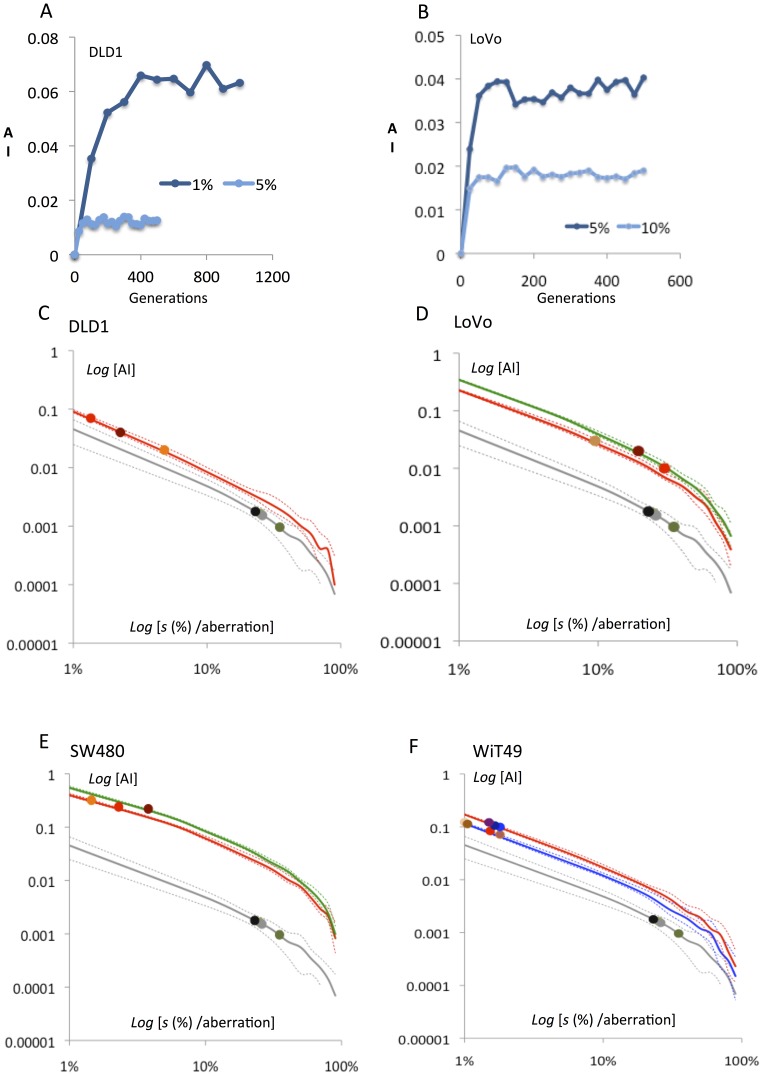
Figure 4. Modelling of aneuploidy rates as a function of negative selection against chromosome changes in cancer cells.
(A–B) A dynamic equilibrium with respect to aneusomy index (AI) is reached before 500 generations even with very low negative selection pressures in cancer cell populations with a low mis-segregation rate (exemplified by 1% for DLD1 having a near-normal mis-segregation rate). Both plots are from single simulation runs. (C–F) In all four analyzed cancer cell lines simulations predicted a near-linear negative relationship between anusomy index (AI) and the degree of negative selection (s) on a log-log scale. Full lines indicate mean AI values and broken lines the minimum and maximum values for each simulation of AI for a certain s. Grey lines correspond to simulated AI for normal fibroblasts and grey circles indicate AI quantified by FISH for chromosomes 2 and 17 in fibroblasts. Coloured lines correspond to simulated AIs for chromosomes of different modal numbers and coloured circles the FISH-estimated AI values for the analysed chromosomes in the cancer cell lines. Except for one chromosome in LoVo, the negative selection pressures acting on aneusomic cells are lower in the cancer cell lines. The full data calculated from these AI-s estimates are presented in Table 1 and summarised in Figure 5.

