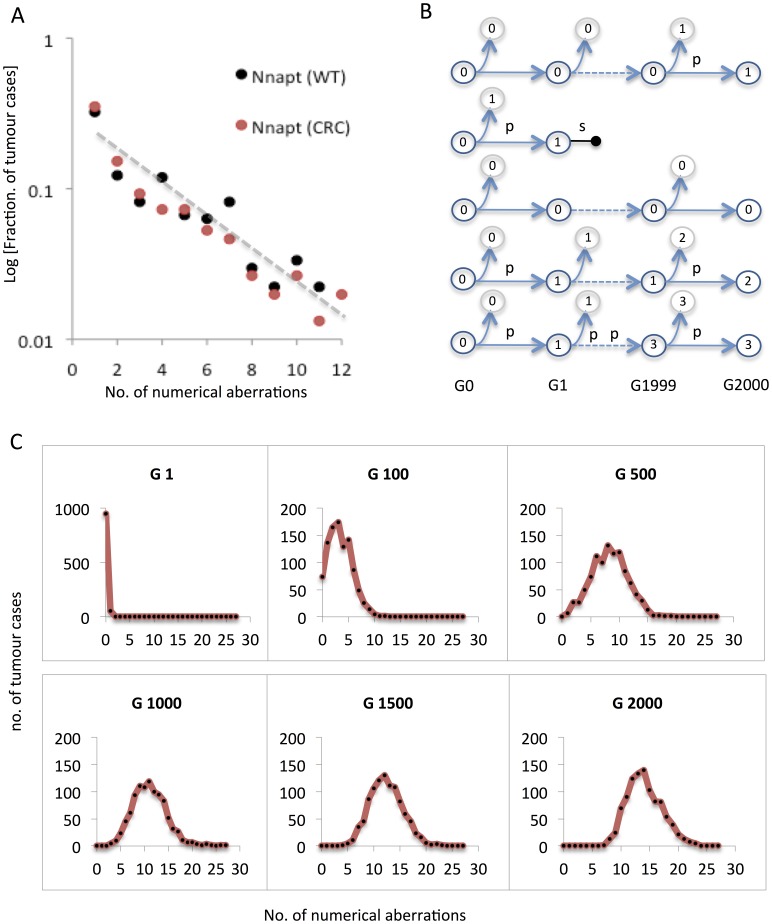
Figure 6. Modelling the distribution of aneuploidy burden in human cancers.
(A) Reported cytogenetic data from the Mitelman Database of Chromosome Aberrations and Gene Fusions in Cancer show a log-linear relationship between the relative prevalence and the number of numerical aberrations per tumour (Nnapt), with highly similar distributions for Wilms tumour (WT) and colorectal cancer (CRC). (B) Modelling of a certain number of cancer stemlines arising in the same number of patients. Each stemline is assumed to derive from a diploid cell (having 0 numerical aberrations) and is allowed to proliferate for a maximum of 2000 generations (G), when the overall distribution of numerical aberrations is sampled. Stemlines accumulate numerical aberrations at a certain mis-segregation rate (p) and are subject to aneuploidy-dependent selection at a certain degree (s), which may in turn result in termination of the stemline (horizontal dumbbell), corresponding to the end of clonal expansion. Because this may result in regression of tumorigenesis at an early stage, cases where stemlines were thus terminated were removed from sampling. (C) Simulated distribution of tumour cases with a certain number of numerical aberrations as the tumour cohort is sampled at generations 1–2000 in a setting where tumours harbour an elevated mis-segregation rate in the absence of negative selection against aneuploid cells (see main text for details). This will result in a binomial-like distribution already after 100 generations, the modal value of which increases with time, in contrast to the actual distribution in human tumours (compare to 6A).

