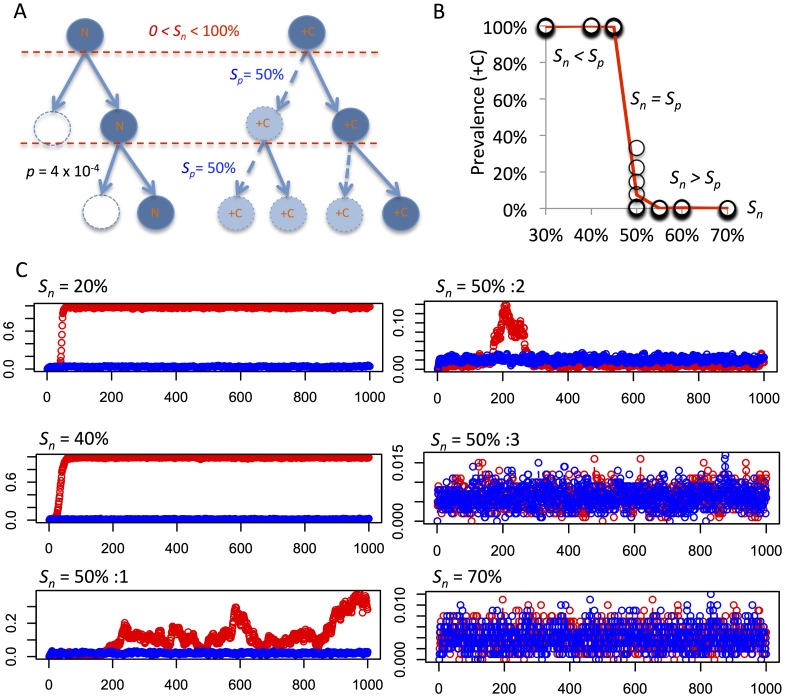
Figure 9. Clonal expansion in a context of normal chromosome mis-segregation.
(A) Evaluation of clonal expansion of cells with trisomy for a single chromosome (+C), set up under similar conditions as described in Figure 8 but with a mis-segregation rate similar to normal fibroblasts (p = 4×10⁻⁴), a constant rate of positive selection (Sp) of 50%, and a variable degree of negative selection against aneuploidy (Sn). Parallel simulations were performed with a control population with equal conditions except for an absence of positive selection. (B, C) A clonal expansion resulting in dominance of cells with +C (prevalence >99%) after 1000 generations is observed when Sp> Sn, while Sp = Sn results in variable prevalence of cells with +C, including expansion up to a prevalence of 33% (Sn = 50%:1 in C), expansion followed by regression (Sn = 50%:2 in C), and a lack of clonal expansion (Sn = 50%:3 in C). Each circle in B corresponds to a single run of simulations, with 10 runs per level of Sn, while the red line corresponds to mean results. Red plots in C correspond to prevalence of +C cells under positive selection and blue plots reflect the results of parallel control simulations with Sp = 0; x axes denote mitotic generations.

