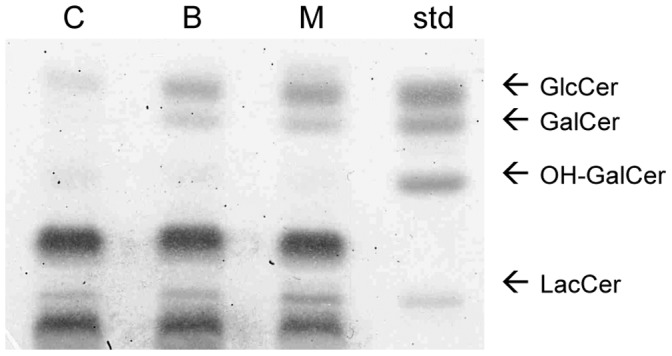
Figure 2. Changes in the mass of GlcCer, GalCer and LacCer.

HSF cells were treated with BFA or monensin for 24 h and visualized with orcinol-sulphuric acid on a high performance TLC silica plate. OH-GalCer, hydroxylated GalCer. The representative TLC plate shown here was chosen from one of three independent experiments with similar results.
