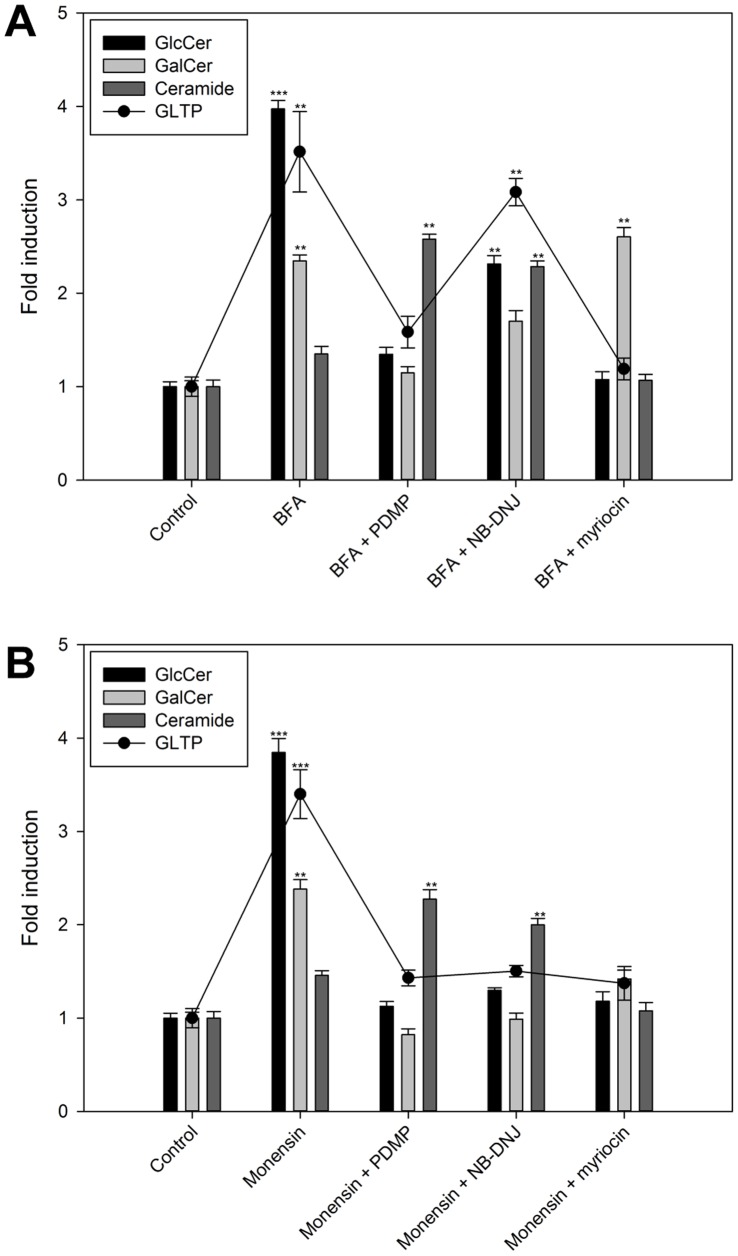
Figure 5. GlcCer, GalCer and Cer and GLTP mRNA levels in HSF cells co-treated with BFA/monensin and different GlcCer synthesis inhibitors.
A) 3H-sphinganine incorporation and GLTP mRNA levels (filled circles) in HSF cells treated with either BFA (0.01 µg/ml) as well as HSF cells co-treated with BFA in addition to PDMP (50 µM), NB-DNJ (250 µM) and myriocin (25 µM). B) 3H-sphinganine incorporation and GLTP mRNA levels (filled circles) in HSF cells treated with either monensin (5 µg/ml) as well as HSF cells co-treated with monensin in addition to PDMP (50 µM), NB-DNJ (250 µM) and myriocin (25 µM). HSF cells treated with myriocin were labeled with 3H-palmitic acid. The results are expressed as means +/− SD of three independent experiments. Two asterisks (**), p<0.01 and three asterisks (***), p<0.005 indicate the statistical significance compared to the controls.

