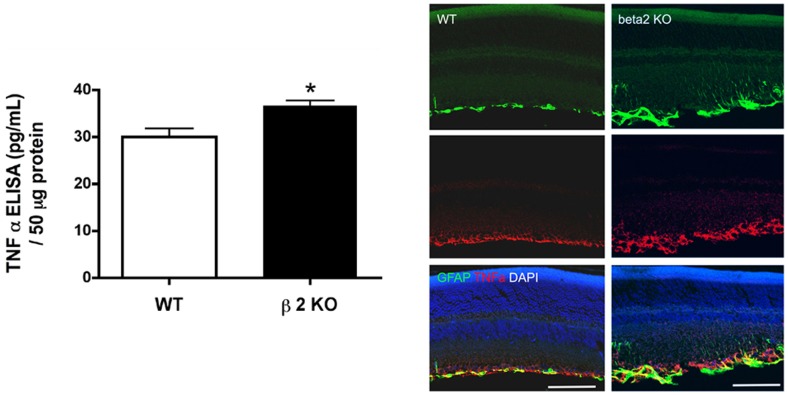
Figure 9. TNFα levels and localization.
Top Left Panel: TNFα concentrations in retinal lysates from β2-adrenergic receptor knockout and wildtype mice. *P<0.05 vs. wildtype. ELISA data was normalized to protein loaded into well. N = 6 mice in each group. Top Right Panel: Confocal microscopy for TNFα (red), GFAP (green), and nuclei (blue). Scale bar is 50 um.

