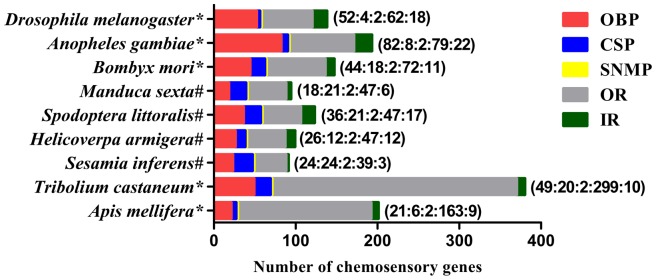
Figure 5. The number of chemosensory genes in different insect species, obtained from genome (*) or antenna transcriptome (#).

The digits by the histogram bars represent number of chemosensory genes in different subfamilies (OBP:CSP:SNMP:OR:IR). The data are obtained from the current study for S. inferens and from the references [6], [10], [70], [71] for Drosophila melanogaster, [6], [10], [70], [71] for Anopheles gambiae, [10], [24], [38], [65], [71], [72] for Bombyx mori, [6], [10], [70], [71] for Tribolium castaneum and Apis mellifera, [31] for Manduca sexta, [29], [30] for Spodoptera littoralis and [33] for Helicoverpa armigera.
