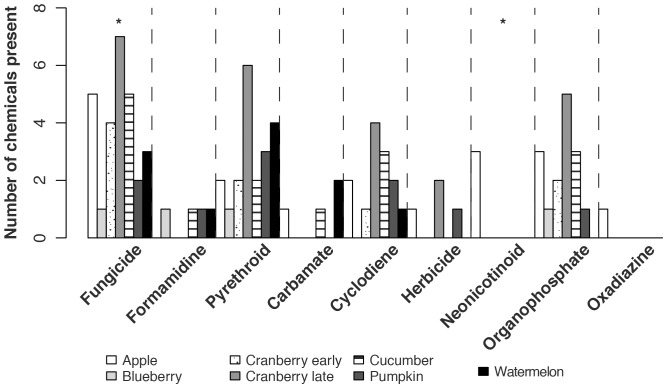
Figure 3. Fungicide and neonicotinoid diversities varied by crop.
Bars show the total number of pesticides in each category found in each crop. Kruskal-Wallis test statistics comparing pesticide diversity between crops are: fungicides, H6 = 16.1, p = 0.01; cyclodienes, H6 = 6.9, p = 0.33; neonicotinoids, H6 = 17.9, p = 0.007; organophosphates, H6 = 14.3, p = 0.03; pyrethroids, H6 = 7.8, p = 0.26. We only compared pesticide diversities for categories containing at least three chemicals. Sequential Bonferroni adjusted critical values are: 0.01, 0.0125, 0.0167, 0.025, 0.05. A * indicates that the total number of pesticides varied between crops within that pesticide category.

