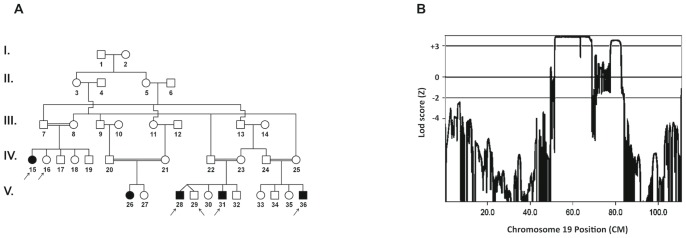
Figure 1. Linkage analysis of the family suffering from autosomal recessive atypical congenital myopathy.

(A) Pedigree of the family. Filled and unfilled symbols represent affected and unaffected individuals, respectively. The arrows denote individuals whose DNA samples were analyzed by SNP250K. (B) Multipoint linkage analysis using SNP data showing LOD score Zmax = 3.86 at θ = 0.0 on chromosome 19q13. X-axis: genetic distance in cM., Y-axis: Lod score.
