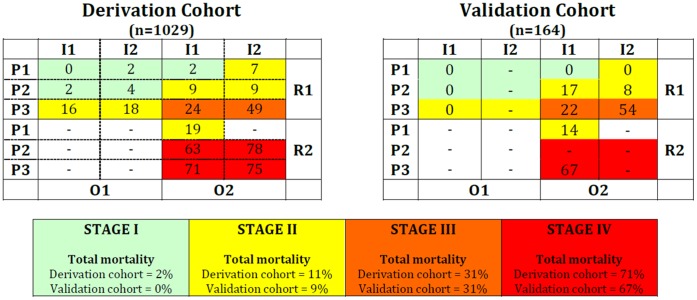
Figure 2. Different stages of PIRO obtained according to the different combinations of Predisposition (P1, P2, P3), Insult (I1, I2), Response (R1, R2) and Organ dysfunction scores (O1, O2).
The numbers represent the mortality rate for each state, e.g., the state P1I1R2O2 had a mortality of 19% in the derivation cohort and 14% in the derivation cohort. Only states with more than 5 patients were considered. The dashes (−) indicate that there was not enough patients in the respective state to evaluate mortality.

