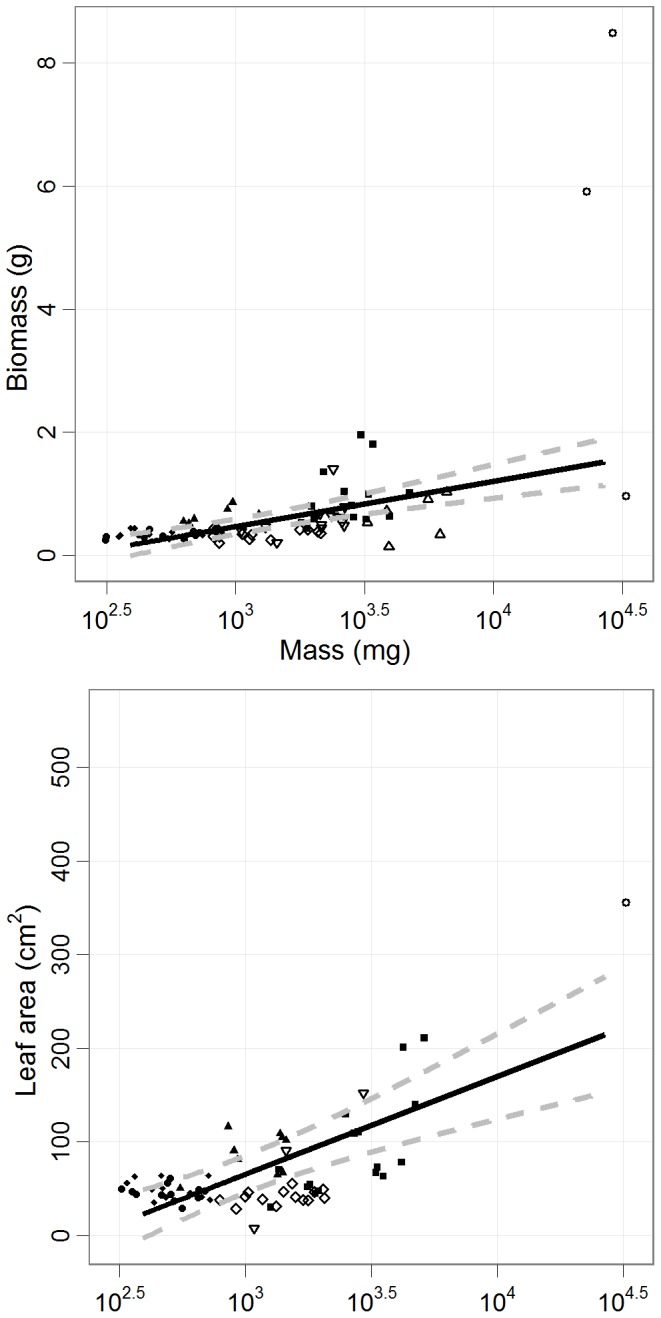
Figure 3. Relationship between growth and seed mass in daily watering.

The relationship of baseline biomass and leaf area as a function of seed mass in the daily watering treatment (mean ±95% CI). Unequal variance was accounted for using a weighted variance for each species. Leaf area was based on the last harvest after 60 days. Points represent individual seedlings. (SM: open circle, PT: upward triangle, DL: closed square, PM: downward triangle, HN: open diamond, SB: closed triangle, SP: closed diamond, SA: closed circle).
