
Figure 6. Rooting depth per leaf area as a function of seed mass.
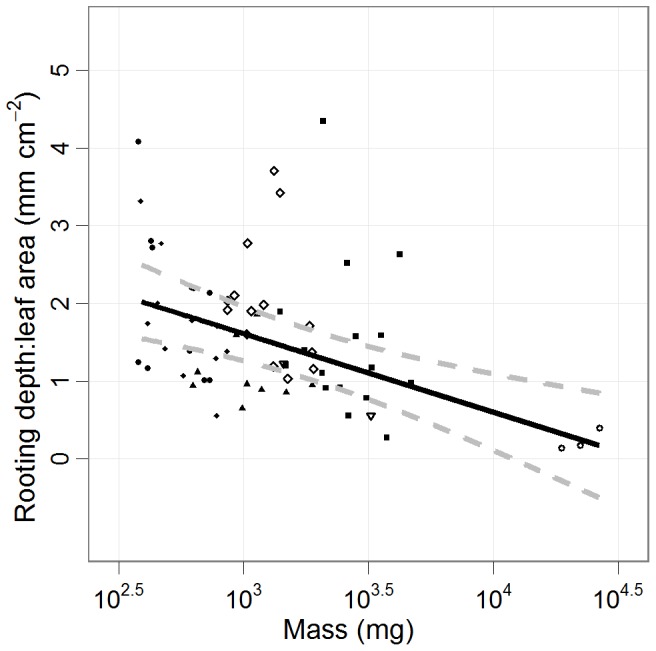
Root depth per leaf area (mean ±95% CI) as a function of seed mass. Unequal variance was accounted for using a weighted variance for each species. Large-seeded species produce much larger leaves increasing transpiration and water demand without proportionally larger rooting depth, leaving them susceptible to breaks in hydraulic conductivity and water stress. Points represent individual seedlings. (SM: open circle, PT: upward triangle, DL: closed square, PM: downward triangle, HN: open diamond, SB: closed triangle, SP: closed diamond, SA: closed circle).