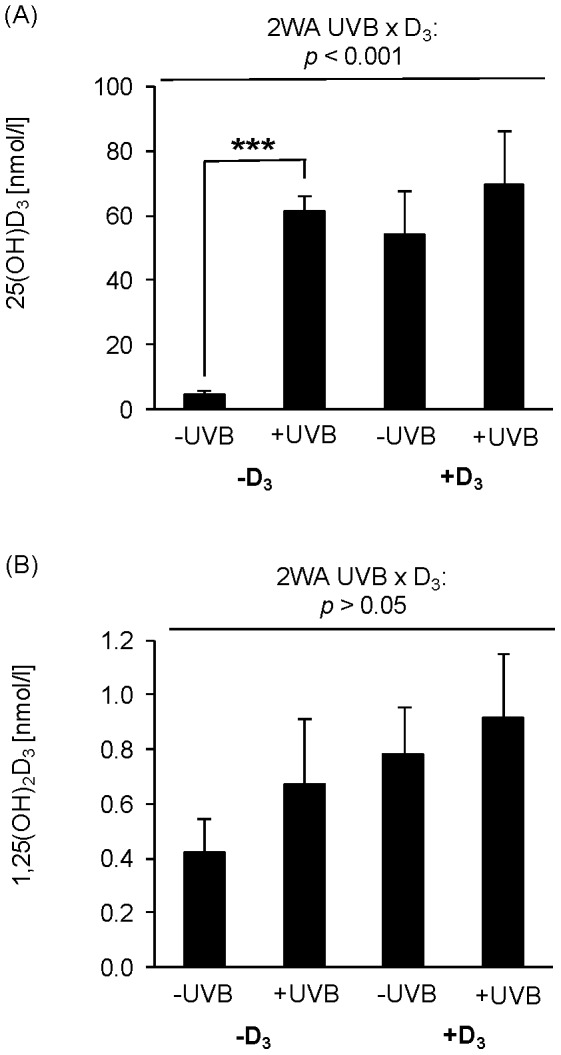
Figure 2. Vitamin D status of chickens in response to UVB exposure and dietary vitamin D3.

(A) Data in the top panel represent mean ± SD (n = 9) of plasma 25(OH)D3 concentrations in non-treated (-UVB) or UVB-treated (+UVB) hens that were fed either a vitamin D3-deficient (-D3) or vitamin D3-adequate diet (+D3), respectively. Data were analyzed by two-way ANOVA with the classification factors UVB exposure, vitamin D3 in the diet, and the interaction between both factors. Effect of UVB: p<0.001, vitamin D3: p<0.001, UVB × vitamin D3: p<0.001. Individual means of the groups were compared by post-hoc test. Asterisks within one diet (-D3 and +D3) indicate a significant difference between -UVB and +UVB groups, ***p<0.001. (B) Data in the bottom panel represent mean ± SD (n = 9) of plasma 1,25(OH)2D3 concentrations in non-treated (-UVB) or UVB-treated (+UVB) hens that were fed either a vitamin D3-deficient (-D3) or vitamin D3-adequate diet (+D3), respectively. Data were analyzed by two-way ANOVA with the classification factors UVB exposure, vitamin D3 in the diet, and the interaction between both factors. Effect of UVB: p<0.001, vitamin D3: p<0.001.
