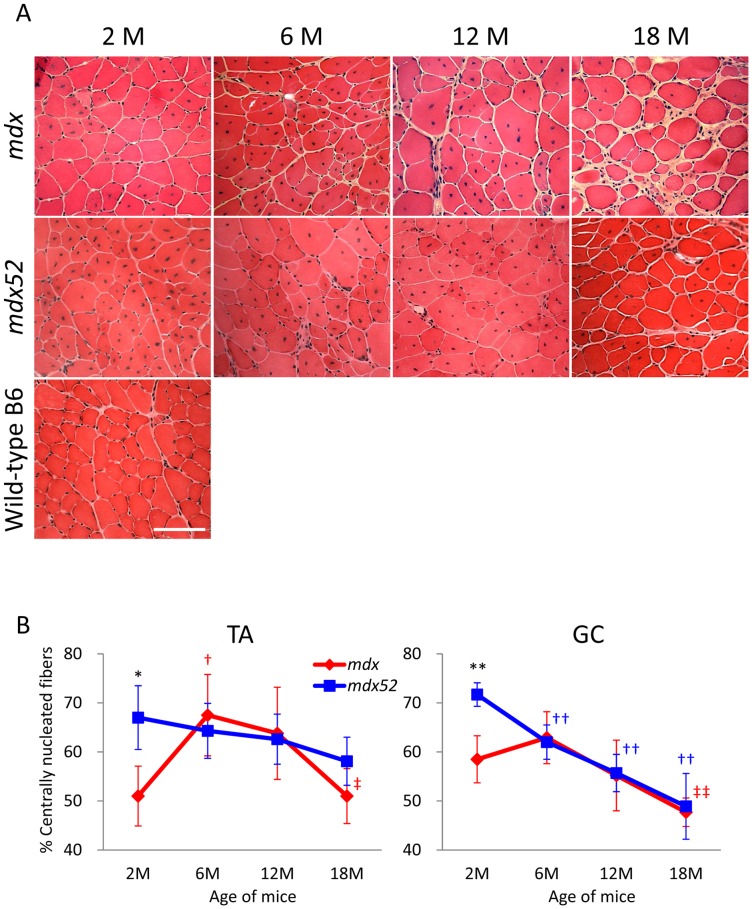
Figure 3. Distinct changes in the percentage of centrally nucleated fibers by mutations and age in mdx and mdx52 mice.
(A) Representative images of TA muscles from mdx and mdx52 mice at ages 2, 6, 12 and 18months with hematoxylin and eosin staining. Wild-type C57BL/6 muscle at 2months of age is displayed as a control. M: months. Scale bar = 100μm. (B) The percentage of centrally nucleated fibers in TA and GC muscles from mdx and mdx52 mice. Three hundred to one thousand myofibers were counted in left and right muscles and the percentage of CNFs was averaged between the two muscles per mouse. Values are mean ± S.D. (n = 3–6 mice per group). *P<0.05, **P<0.01 between mdx and mdx52 mice; †P<0.05, ††P<0.01 compared to 2months old; ‡P<0.05, ‡‡P<0.01 compared to 6months old. Symbol colors are accordant with the color of mice (red; mdx, blue; mdx52).

