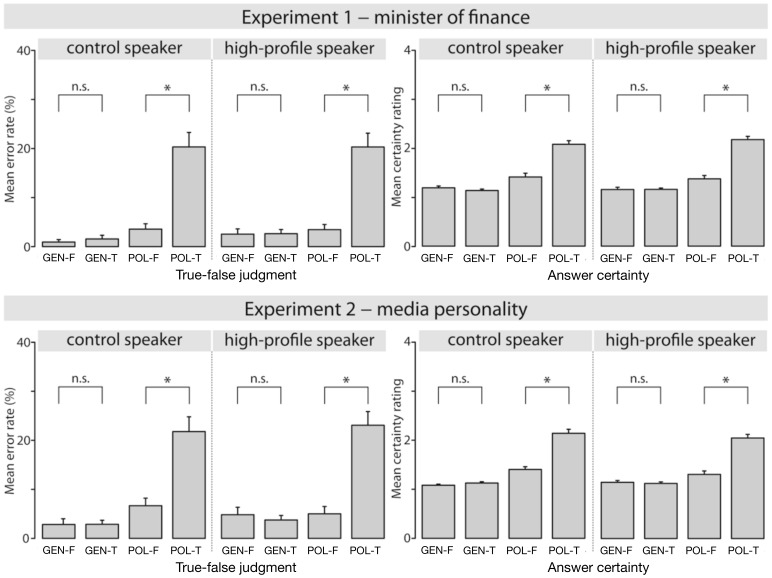
Figure 2. Results of the behavioral tasks.
Results for Experiment 1 are shown in the top panel and results for Experiment 2 are shown in the bottom panel. In both cases, mean error rates for the true-false judgment are shown on the left-hand side, whereas mean certainty judgments are shown on the right-hand side. For the certainty judgments, the four-point scale was defined as follows: 1 (very certain) –4 (completely uncertain).

