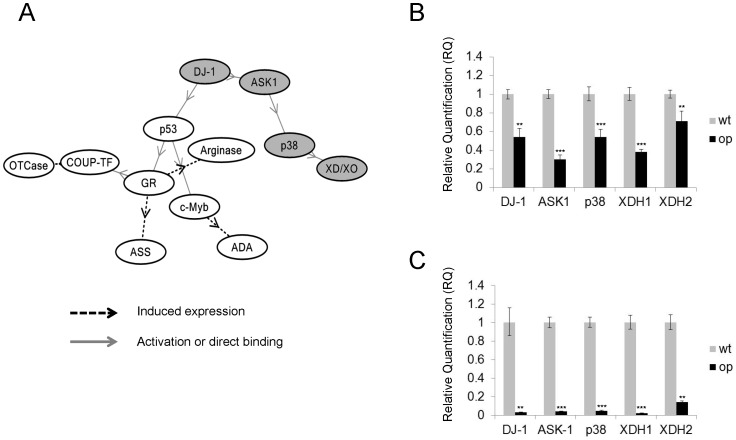
Figure 2. Microarray screening and quantitative RT-PCR confirmation of genes that are down-regulated in op.
(A) Molecular network generated by KeyMolnet for genes showing variation in op. Molecular relations are indicated by solid lines with arrows (direct binding or activation) or broken lines with arrows (induced expression). The pathway from DJ-1 to XD/XO is highlighted in gray. Relative mRNA expression in (B) fat body and (C) testis in wild-type and op mutant as Relative Quantification (RQ) values. RQ represents the relative expression level compared to the reference sample. Error bars represent the relative minimum/maximum expression levels about the mean RQ expression level. (B) DJ-1(p = 0.0038), ASK1(p = 0.0005), p38(p = 0.0004), XDH1(p = 0.0009), XDH2(p = 0.0011), (C) DJ-1(p = 0.0008), ASK1(p<0.001), p38(p<0.001), XDH1(p = 0.0009), XDH2(p = 0.0075).

