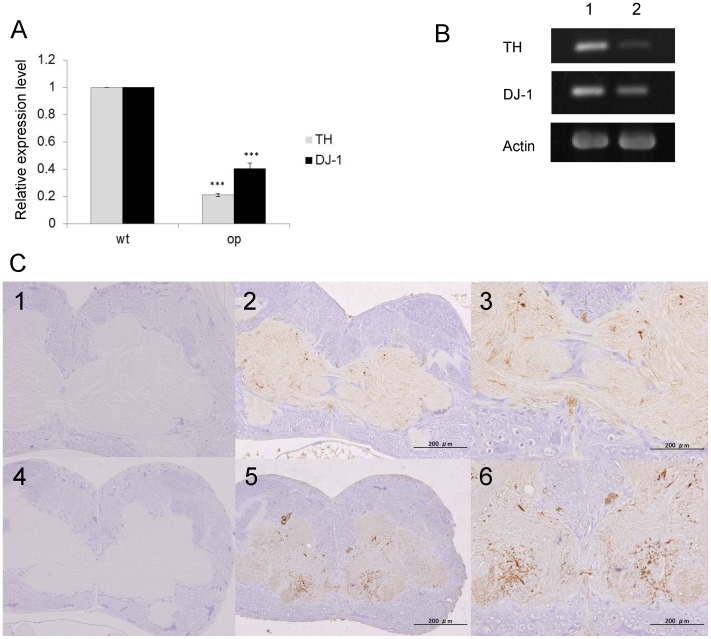
Figure 3. B. mori TH and DJ-1 mRNA expression in brain of wild-type and op mutant larvae by RT-PCR.
(A) mRNA expression levels were measured by Image J ver. 1.37 c, and plotted to compare op and wild-type mRNA levels (TH; P<0.0001, DJ-1; P = 0.0017). (B) Lane 1, wild-type; lane 2, op mutant. (C) Immunohistochemical localization of tyrosine hydroxylase (TH) in op and wild-type brain. Tissue sections were prepared from day 5 to 7 fifth instar larvae. 1 (op) and 4 (wild-type) are negative controls. TH positive regions (2 and 3:op, 5 and 6:wild-type) are stained brown. Bar: 200 µm.

