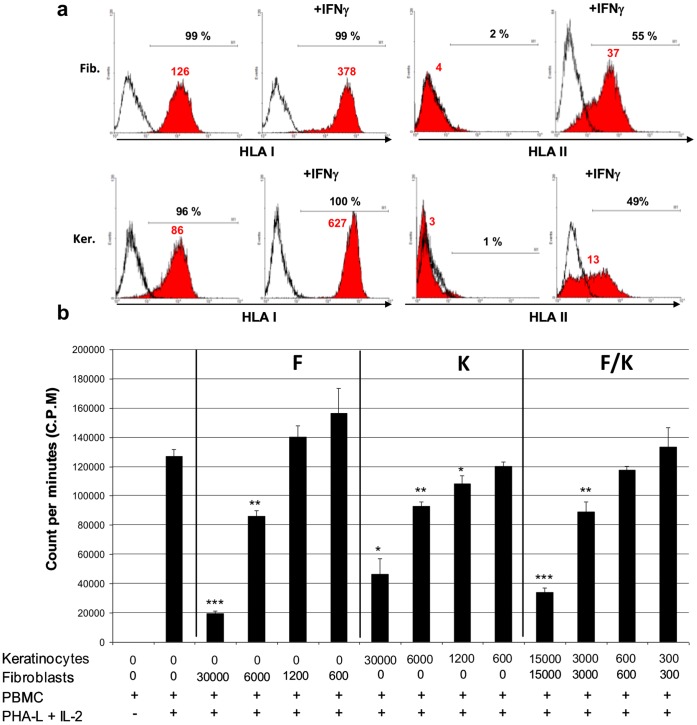
Figure 2. Immunogenicity and Immunosuppressive activity of fetal cells.
A, MHC class I and class II expression in fetal cells. Flow cytometry analysis of MHC class I and class II expression in fetal fibroblasts and kerationcytes treated or not with 1 µg/ml IFN-γ for 48 hours. Full histograms represent test samples, solid lines represent isotypic controls. Percentage of positive cells and mean fluorescence intensity values (MFI) are indicated. Cytograms are typical of two independent experiments. B, Proliferation of allogeneic PBMC in co-culture with fetal fibroblasts, keratinocytes or both cell types in co-culture. PBMC were initially plated with various fetal cell numbers corresponding to four different ratios between fetal cells and PMBC, 1∶4, 1∶20, 1∶100 and 1∶200. PBMC were collected from the co-cultures after 5 days and treated with 3H-thymidine for 16 hours before radioactive counting. Data represent the means ± SD (n = 3) of 3H-thymidine incorporation by proliferative PBMC. Asterisks denote significant differences in PBMC proliferation compared to the positive control (column 2) (*, p<0.05; **, p<0.01; ***, p<0.001). Data are representative of three independent experiments performed with PBMC obtained from different healthy donors.

