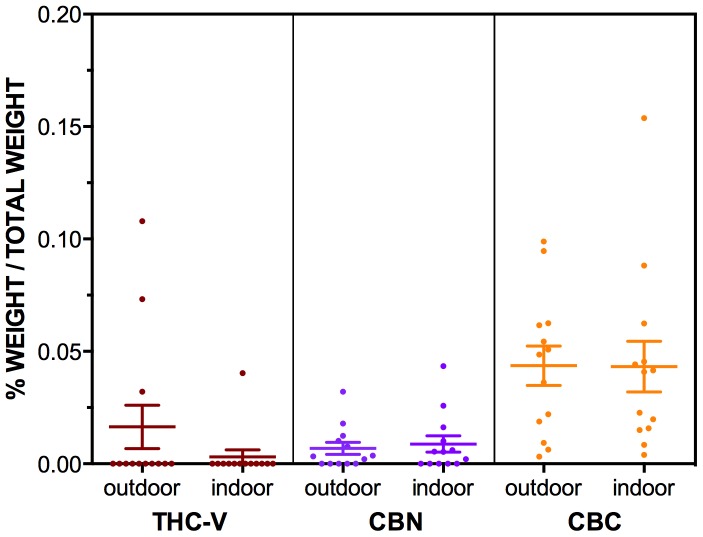
Figure 5. The levels of THC-V, CBN and CBC in n = 13 outdoor grown (NSW North Coast) and n = 13 indoor grown (Sydney) “Known Provenance” samples.
Levels of cannabinoids are expressed as mean % of total weight of sample (w/w%), with ± SEM bars shown. Note the differing scales relative to Figure 4.

