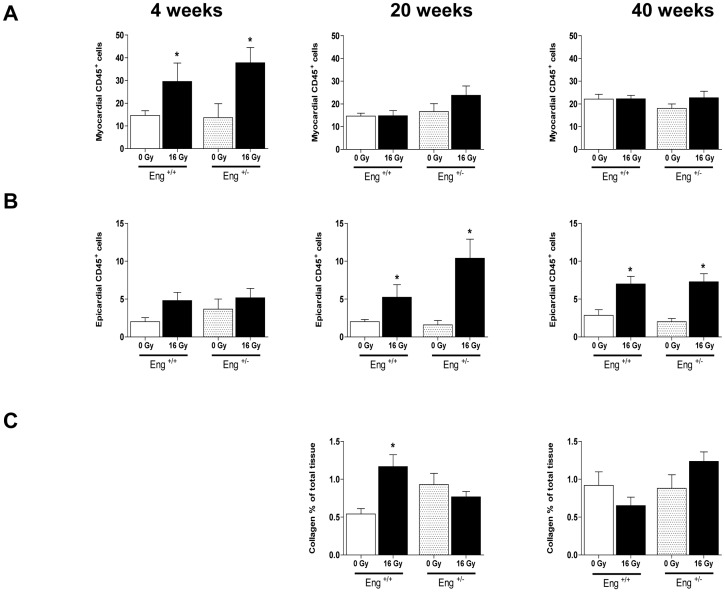
Figure 6. Inflammatory and fibrotic changes at 4, 20 and 40 weeks after irradiation or sham treatment.
(A) Quantification of CD45+ cells per section in the myocardium and (B) epicardium. (C) Percentage interstitial collagen content of irradiated heart sections, relative to age-matched unirradiated controls. Values represent mean ± SEM with 3–6 mice in the 4 weeks group, 4–5 mice in the 20 weeks group and 5–7 in the 40 weeks group, *p<0.05 compared to age-matched unirradiated controls.

