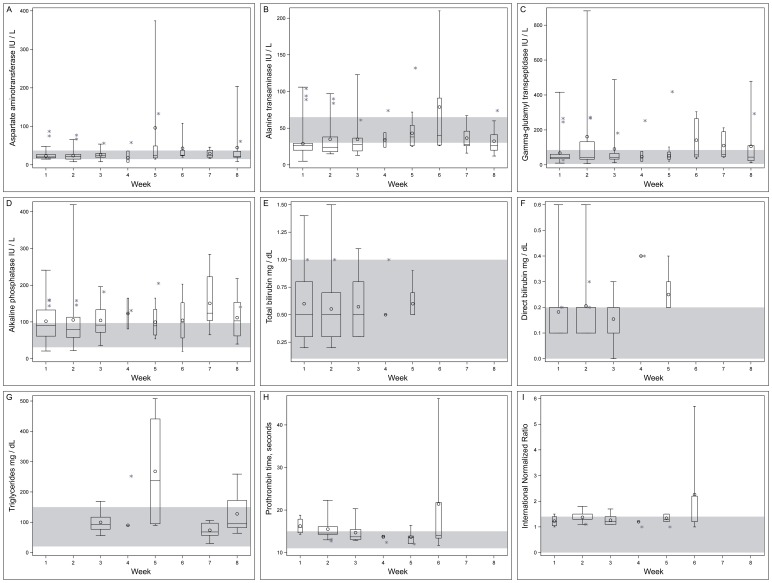
Figure 2. Clinicopathological biochemical outcomes among patients by week of study, a) aspartate aminotransferase, b) alanine aminotransferase, c) gamma-glutamyl transpeptidase, d) alkaline phosphatase, e) total bilirubin, f) direct bilirubin, g) triglycerides, h) prothrombin time, i) international normalized ratio.
Mean (circle), median (line), first - third quartiles (box), minimum, maximum values (whiskers). Values for the one hepatitis B seropositive patient are shown as asterisks and not included in the boxplots. Width of box is relative indicator of number of samples included in analysis each week. Shaded area is reference range for laboratory.

