
Figure 5. Phylogeny of virB5 gene sequences using Maximum likelihood, with a GTR substitution model.
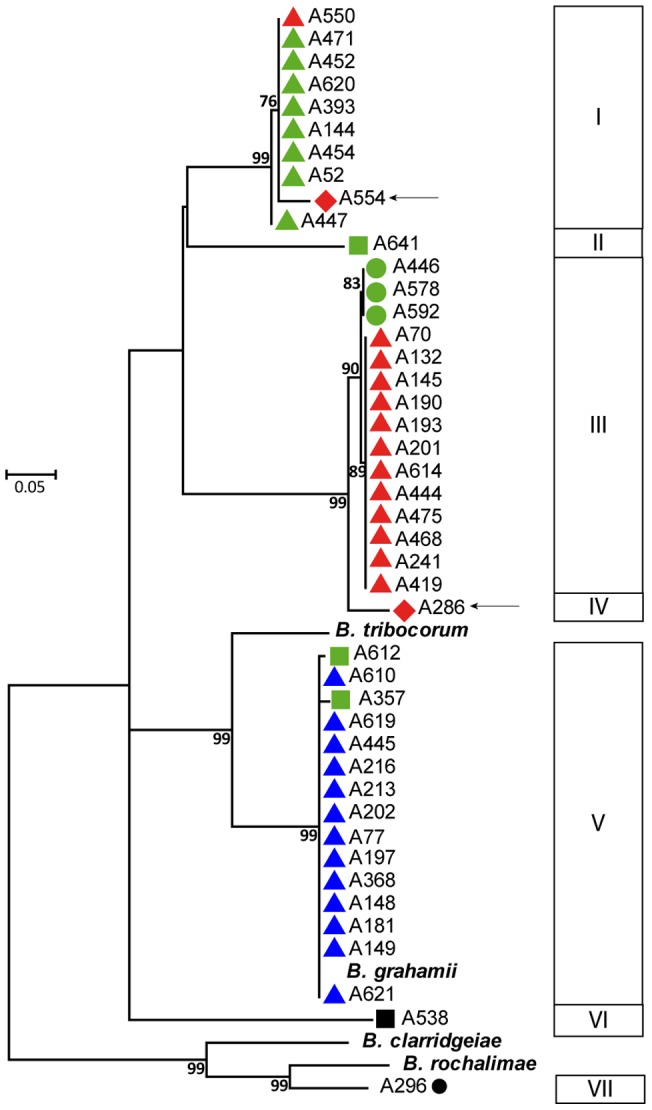
Clusters in which virB5 alleles were found are indicated by colors and shapes identical to Figure 1 (see legend). Bootstrap values higher than 80% are given at the nodes. Arrows indicate virB5 sequences amplified and sequenced from strains obtained from wood mice.