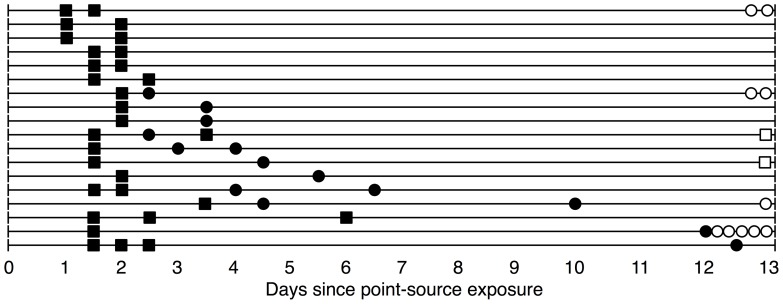
Figure 1. Observations for 18 households with non-index cases.
The figure illustrates the time course of infection in the 18 households in which there was a non-index case who became ill after the onset of symptoms in the index case. Filled boxes indicate an individual who dined at the point-source and became ill. Filled circles indicate individuals who became ill and did not dine at the point-source. Hollow boxes and circles along the right margin indicate the number of individuals in the household who did and did not dine at the point source and did not become ill, respectively. The additional 52 households in the analysis with no secondary cases are not pictured.

