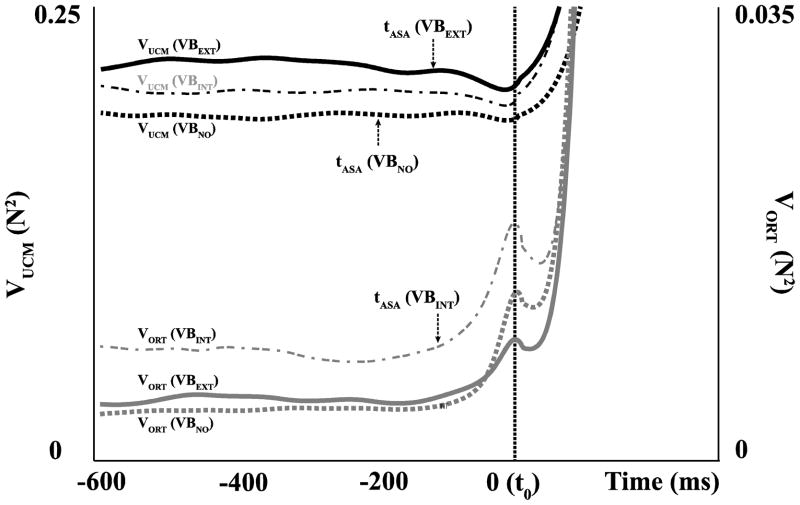
Figure 3.
The two components of variance, VUCM (black line) and VORT (gray line), during vibration applied to the hand (VBINT, dash-dot line), to the forearm (VBEXT, solid line), and in the no-vibration condition (VBNO, dashed line). VUCM and VORT were quantified per degree-of-freedom, and the average across subjects values are presented. The times of ASA initiation are shown with the arrows corresponding to a drop in ΔVZ (see Figure 4).

