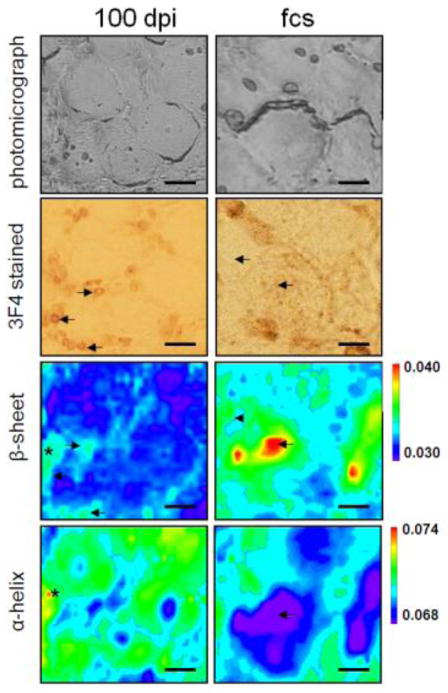
Figure 4.
FTIRM of the misfolded prion protein in a hamster model of scrapie showing results from a preclinical stage 100 days post infection (left column, 100 dpi) and at the first clinical signs of the disease (right column, fcs). Photomicrographs of the areas investigated with FTIRM are shown in the 1st row (unstained) and 2nd row (3F4-antibody stained for the prion protein). The β-sheet and α-helix distributions are represented in the 3rd and 4th rows, respectively. At the earliest stages, some areas show high β-sheet as well as high α-helix (*), which was not observed at the terminal stage. Areas with misfolded prion protein deposition as seen in the 3F4 stained sections showed elevated β-sheet (arrows), while some areas showed high β-sheet but no aggregate deposition (arrowheads). All scale bars are 20 μm. With permission from [17].

