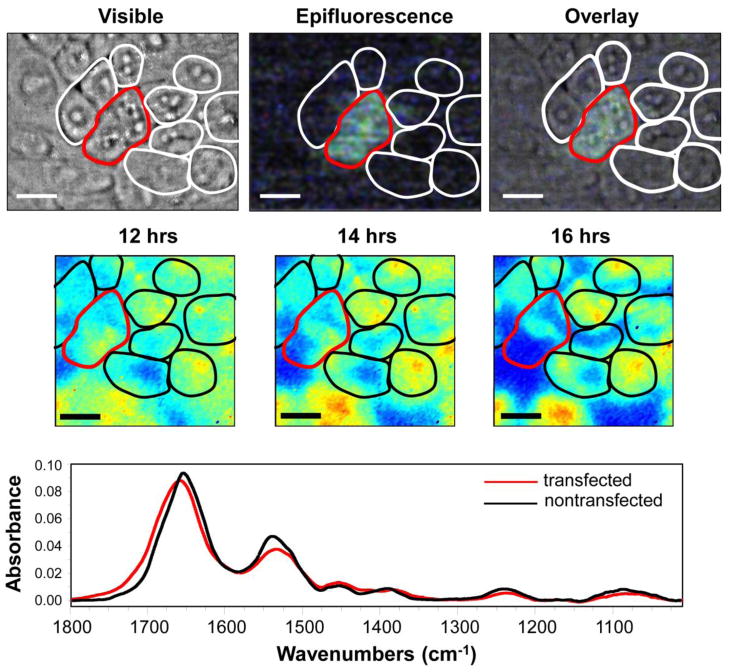
Figure 5.
Time-lapsed FTIR imaging of CHO-K1 cells transiently transfected to overexpress the mutant, G37R-SOD1, over the course of 16 hours. (Top row) Photomicrographs of a field of ~12 cells showing a positive transfection in 2 cells as identified by the yellow-green fluorescence from the fusion tag, YFP, and outlined in red. (Middle row) FTIRI images from the living cells in a FTIR-compatible incubator at 12, 14, and 16 hours post transfection. False color images show the ratio of 1630 /1695 cm−1, which represents the parallel/antiparallel β-sheet structure. As can be seen, this ratio decreases with time, indicating an increase in the antiparallel β-sheet structure over time, which suggests the formation of pore-forming oligomeric structures. (Bottom) FTIR spectra from the transfected (red) and non-transfected (black) cells, also illustrating an increase in the antiparallel β-sheet conformation in the transfected cells. All scale bars are 10 μm.

