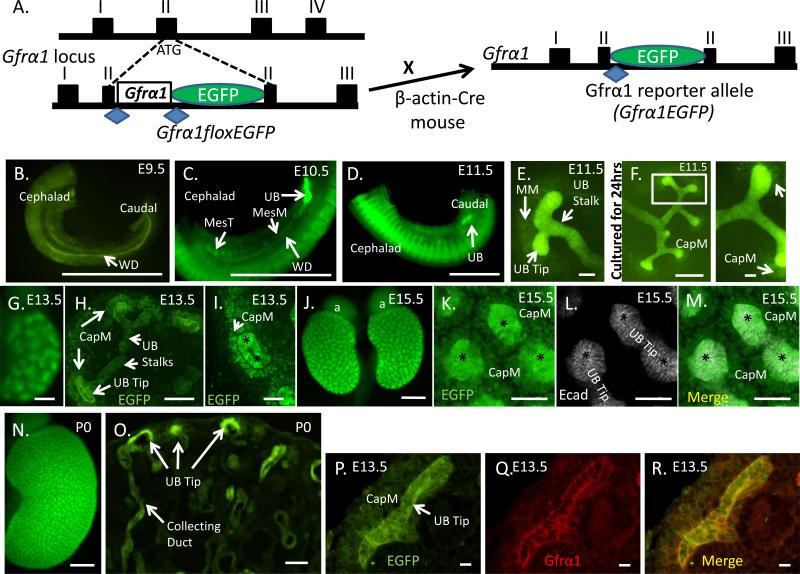
Figure 1. Gfrα1 expression during embryonic kidney development.
(A) Schematic illustrating part of the Gfrα1 locus with conditional allele (Gfrα1floxEGFP) knocked-in exon II. Cre-mediated recombination excises Gfrα1 cDNA flanked by loxP sites (blue diamonds) and expresses EGFP to generate the Gfrα1EGFP reporter allele. (B) Direct visualization of EGFP signal which represents Gfrα1 expression at the indicated time points throughout kidney development. At E9.5, Gfrα1 is expressed in the entire Wolffian duct (WD). (C) E10.5, Gfrα1 expression remains in the WD but shows strong expression in the site of the future ureteric bud (UB). It is also present in the mesonephric mesenchyme (MesM) and the mesonephric tubules (MesT). (D, low power; E, high power) At E11.5 strong Gfrα1 expression is seen in the induced UB and in the stalk. Gfrα1 is also expressed, although at much lower levels, in the metanephric mesenchyme (MM). (F) Metanephric kidney harvested at E11.5 and cultured for 24 hours of continues to show expression in the ureteric epithelium with strong expression in the UB tips and weaker in the cap mesenchyme (CapM) condensing around the UB tips. Boxed region is displayed at higher magnification (right). (G-I) Gfrα1 is expressed in E13.5 metanephroi at strong levels in the UB tips, and weakly in the stalk and cap mesenchyme. Wholemount direct immunofluorescence image is shown in G, anti-GFP immunofluorescence on paraffin embedded sections in H (low power), and I (high power of H) show UB tip, stalk and CapM expression. The expression in the mesenchyme (arrow) is directly adjacent to and surrounding the distal UB tip (asterisk). (J-M) Gfrα1 expression in E15.5 whole mount kidneys. J, whole mount, and K-M are high power images of EGFP, anti-Ecadherin (Ecad, white, epithelium) and merged immunostained images of UB tip (asterisks) demonstrating Gfrα1 expression (green) in UB tip and cap mesenchyme (CapM). (N,O) At postnatal day 0 (P0), Gfrα1 continues to be expressed in the kidney with high expression in the UB tips. (P-R) Double EGFP-Gfrα1 immunolabeling on paraffin sections at E13.5 confirm that EGFP reporter recapitulates Gfrα1 expression in the UB tip and CapM. Scale bar: B-D, 500 μm; E, 50 μm; F, 250 μm, high power UB tip at 50 μm; G, 200 μm; H, 100 μm; I, 50 μm; J, 500 μm; K-M, 50 μm; N, 500 μm; O, 50 μm; P-R, 10 μm. Native fluorescence was used to visualize Gfrα1 expression in panels B-G, J, N and O. Anti-GFP immunostaining was used in H, I, K and P to visualize Gfrα1 expression.

