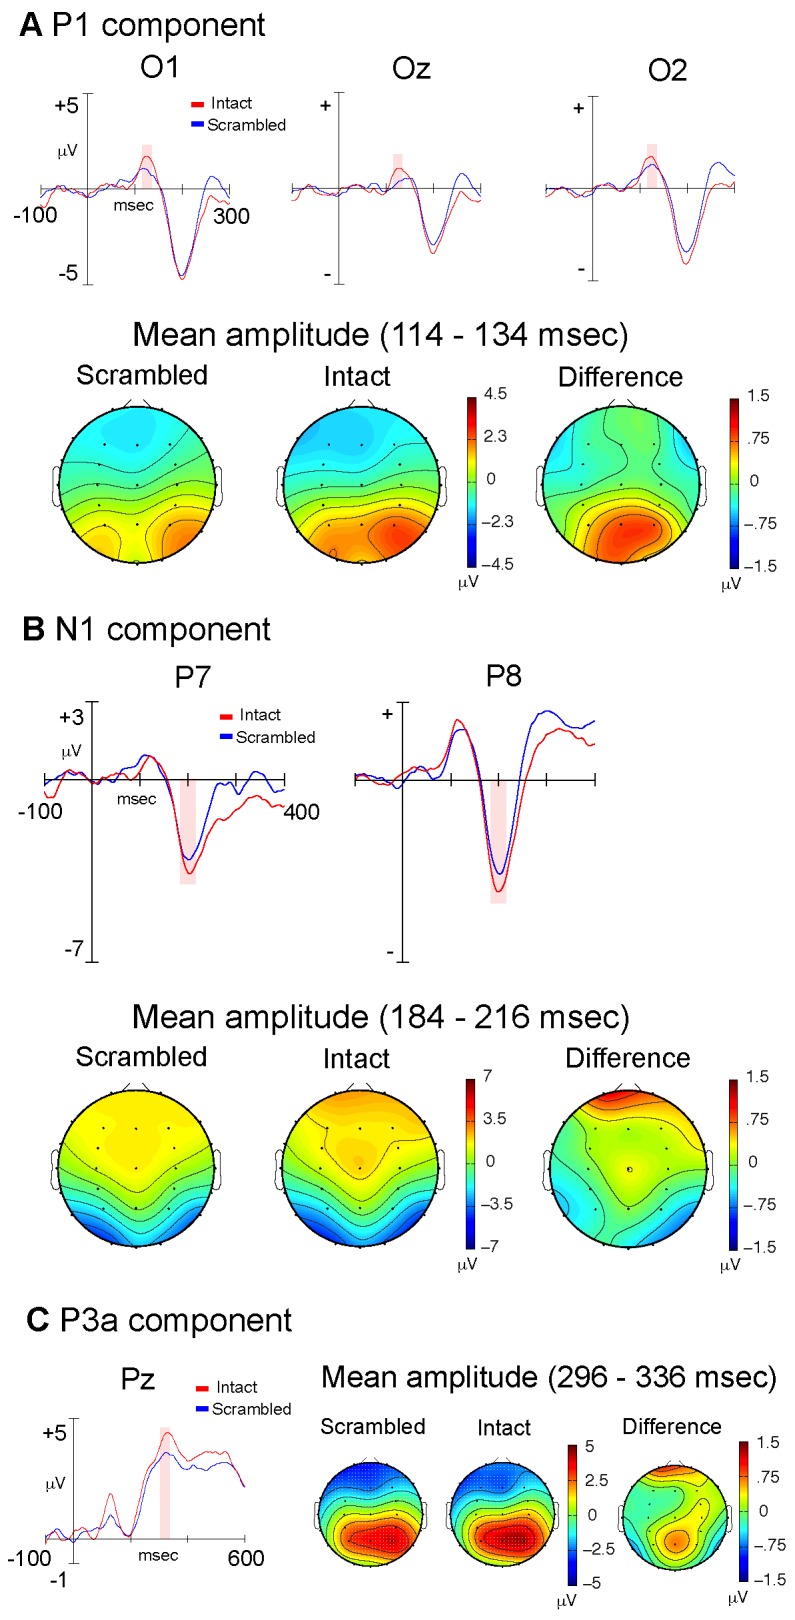
Figure 3. Experiment Two: Static Stimuli.

Stimulus-locked, grand average ERP waveforms and topographic plots for the P1 (A), N1 (B) and P3a components (C), comparing intact (red) and scrambled (blue) static PLW stimuli. The shaded areas shown in the waveform plots indicate the ERP measurement windows. The topographic plots illustrate the scalp distribution of mean component amplitudes derived using the indicated windows.
