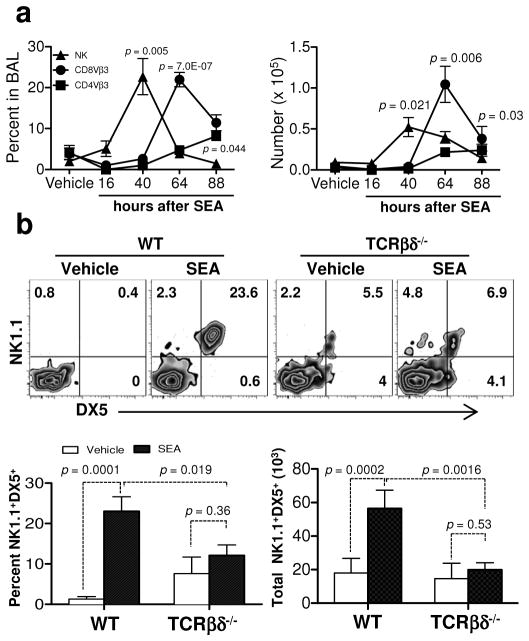
Figure 1.
NK cell recruitment in BAL is T cell dependent in response to SEA. (a) WT (C57BL/6) mice were challenged i.n. with BSS alone (vehicle) or SEA. BAL fluid was collected at 16, 40, 64, and 84 h after SEA challenge, and BAL cells were analyzed by flow cytometery. After gating on live lymphocytes, the percent (left) and number (right) of NK1.1+DX5+, CD8+Vβ3+ and CD8−Vβ3+ cells were quantified at each time point after SEA. Data were combined from 3 independent experiments with n = 3 for vehicle and n = 6 for SEA. (b) Representative plots of BAL cells show NK1.1 and DX5 staining 40 h after SEA treatment. Below bar graphs indicate the percent (left) and number (right) of NK cells from WT and TCRβδ−/− mice. Data were combined from 3 independent experiments with n = 3 for vehicle and n = 9 for SEA. Data shown are Mean +/− SEM. Statistical significance between vehicle and SEA and WT versus TCRβδ−/− mice was evaluated by two tailed Student’s t tests with all p values <0.05.

