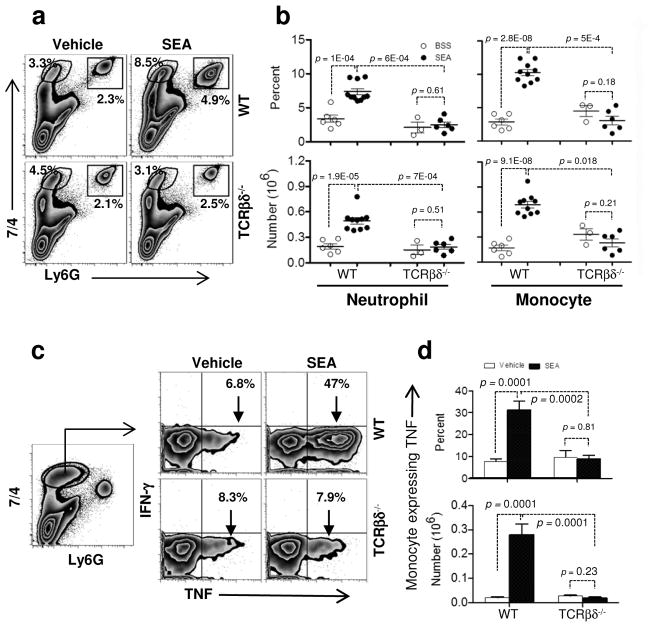
Figure 3.
T cells induce innate cell recruitment and cytokine production in the lung. (a) WT and TCRβδ−/− mice were challenged i.n. with vehicle or SEA. Lung cells from WT (upper panel) and TCRβδ−/− mice (lower) were stained for 7/4 and Ly6G to analyze monocytes (7/4+Ly6G−) and neutrophils (7/4+Ly6G+) 8 h after SEA challenge. (b) Monocyte and neutrophil percentages and numbers are shown from WT and TCRβδ−/− mice. Each dot represents an individual mouse treated either with vehicle (open circles: ○) or SEA (closed circles: ●). (c and d) Lung monocytes from 8 h vehicle and SEA treated mice were stimulated ex vivo with media alone or PMA/I with brefeldin A for 4 h and stained for IFN-γ and TNF (c) and were quantified for monocyte expressing TNF percent (d upper) and number (d lower). Data were combined from 4 independent experiments with n = 6 for vehicle, n = 10 for SEA (WT) and from 2 independent experiments with n = 3 for vehicle, n = 6 for SEA (TCRβδ−/−). Data shown are Mean +/− SEM. Statistical significance between vehicle and SEA was evaluated by two tailed Student’s t tests with all p values <0.05.

