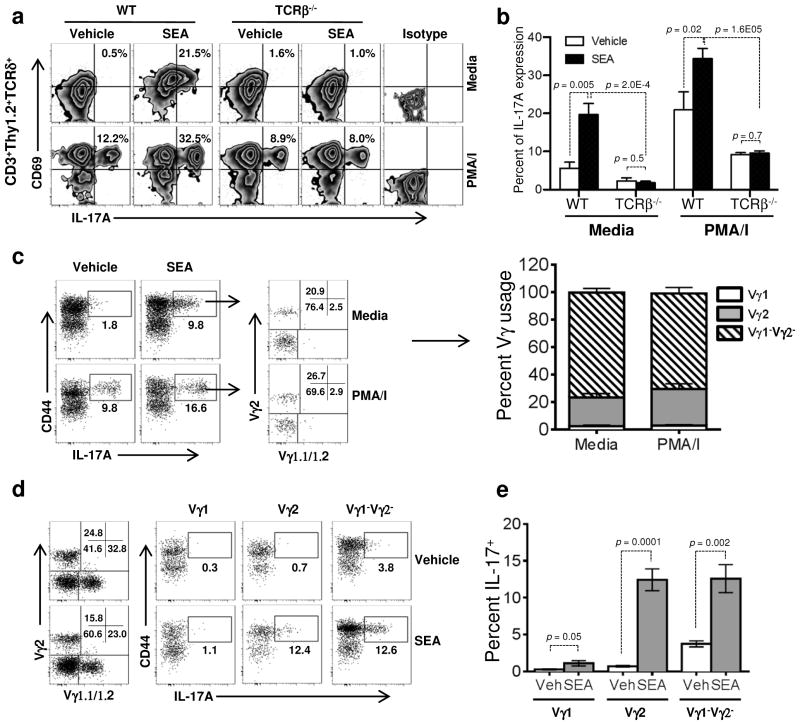
Figure 6.
Crosstalk between TCRαβ and TCRγδ T cell. (a and b) Lung cells were isolated at 6 h from vehicle or SEA treated WT (left) or TCRβ−/− mice (right) and stimulated with media alone (top) or PMA/I (bottom). Cells were stained for CD3, Thy1.2, TCRδ, CD69 and IL-17A, and the CD3+Thy1.2+TCRδ+ T cells were analyzed for CD69 expression and IL-17A production. Bar graphs indicate the percentage of CD3+Thy1.2+TCRδ+ T cells positive for IL-17A. Data were combined from 3 independent experiments with n = 4 for vehicle n = 8 for the SEA treated group in both WT and TCRβ−/− mice. Data shown are Mean +/− SEM. Statistical significance between vehicle and SEA was evaluated by two tailed Student’s t tests with all p values <0.05. (c) Following a 4 h stimulation with media or PMA/I, we gated on SEA-induced CD44highIL-17+ cells within the GL3+CD3+TCRβ− population and stained for individual γδ TCR usage. The percentage of cells expressing Vγ1, Vγ2, or lacking expression of both, are shown graphically. (d and e) Isolating and identifying γδ T cells as above, we gated on the total population of Vγ1+, Vγ2+, and Vγ4+ cells present in the lung tissue at 6 h to assess the percent IL-17+ by individual subsets of γδ T cells following vehicle versus SEA challenge. Representative dot plots are shown at left with data quantified in the graph at right. Data are representative of 3 independent experiments with n=12 for both vehicle and SEA. Statistical significance between vehicle and SEA was evaluated by two tailed Student’s t tests with all p values <0.05.

