
Figure 3.
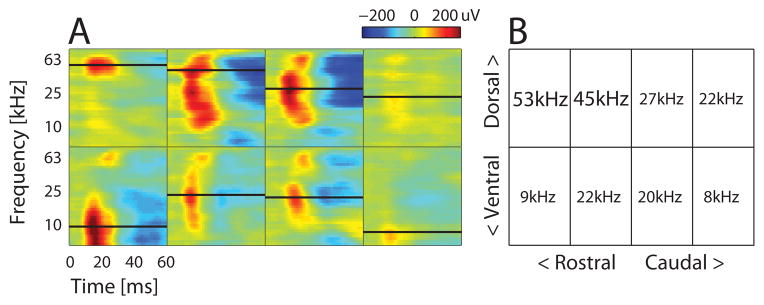
Coarse BF map across stereotaxically targeted grid of holes covering auditory cortex. (A) Time course of LFP amplitudes across all frequencies at each hole (box). Negative LFP deflections are shown as red; positive deflections as blue. Color limits fixed to the maximum and minimum values across the entire map. Black lines in each box indicate the LFP BF for that recording hole, also shown numerically in the grid in (B). High ultrasound BFs in the dorsal-rostral quadrant are from likely UF sites. Note the tonotopic reversal in the second row between AAF to A1.