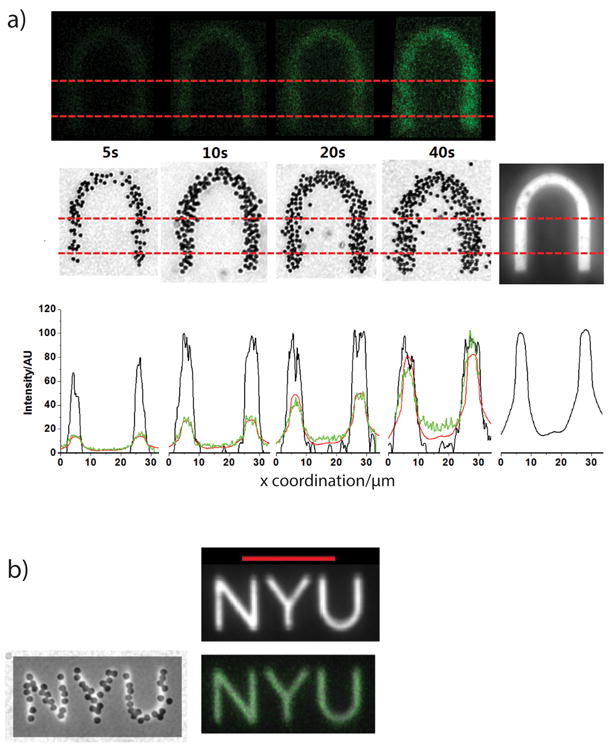
Figure 5. Resolution of DNA photo-lithography.

a) Surface coated with cinnamate-modified DNA strands followed by exposure to UV light through an inverted “U” shaped photomask for different durations of time. (First row) fluorescent images, (second row) colloids' images, (last image in second row) exposed pattern, (bottom row) intensity profile (green curve for first row, black curve for second row, red curve are rescaling of the exposed pattern) between dashed red lines along the x axis.
b) Superimposed colloidal images and fluorescent images with exposed pattern respectively with a resolution of ∼2μm for the smallest feature and ∼1μm for pattern edges.
