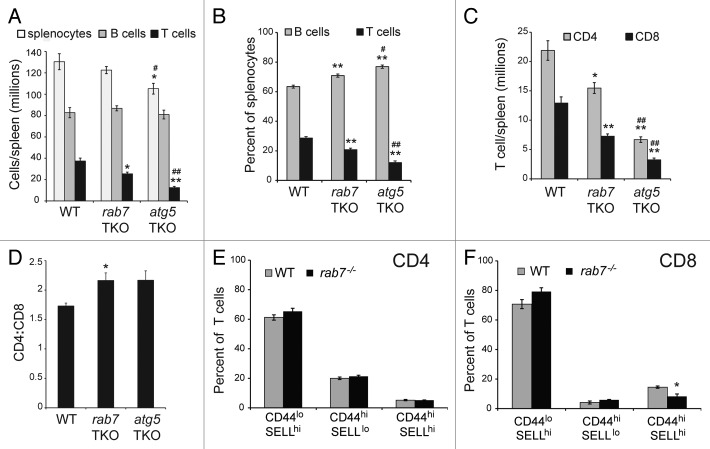
Figure 4. Phenotype of rab7 TKO mice. (A and B) Splenocytes were isolated from mice of the indicated genotypes and the absolute numbers (A) and percentages (B) of B (B220 positive) and T (CD3 positive) cells determined. (C) As in (A), but T cells were divided into CD4- or CD8-positive subsets based on surface staining by flow cytometry. (D) The ratio of CD4:CD8 T cells in spleens from the indicated genotypes were calculated. In (A–D), live cells gates were applied. (E and F) CD44 and SELL levels were measured on live-gated CD4+ (E) and CD8+ (F) splenocytes from wild-type or rab7 TKO mice. In (A–F), means from at least 3 independent experiments are shown, error bars are SEM. A t-test was performed to compare either of the knockout T cells to wild-type (denoted by *) or rab7 TKO and atg5 TKO (denoted by #). * or #p < 0.05; ** or ##p < 0.005.

An official website of the United States government
Here's how you know
Official websites use .gov
A
.gov website belongs to an official
government organization in the United States.
Secure .gov websites use HTTPS
A lock (
) or https:// means you've safely
connected to the .gov website. Share sensitive
information only on official, secure websites.
