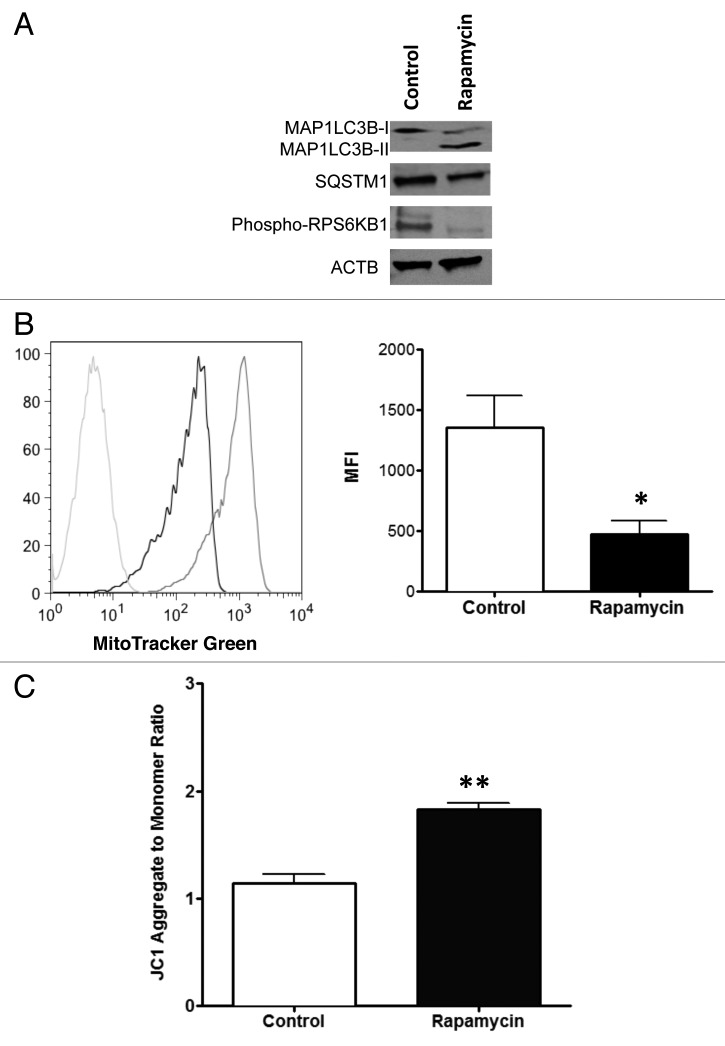
Figure 1. Autophagic phenotype of human T cells after treatment with rapamycin. CD4+ T cells were cultured in the presence of 1 μM rapamycin during 3 d and evaluated for autophagic markers. (A) The cells were lysed and subjected to western blotting using antibodies that detect both MAP1LC3B-I and MAP1LC3B-II (18 KDa and 16 KDa), as well as antibodies against SQSTM1 (62 KDa), phospho-RPS6KB1 (70 KDa) and ACTB (45 KDa). (B) Cells were also stained with MitoTracker Green FM (100 nM) and the mitochondrial mass examined by flow cytometry. A representative histogram is shown (left panel; Rapa treatment, black line; control, gray line; negative control, light gray line) and mean (± SEM) of the mean fluorescence intensity (MFI) of staining was determined by pooling results from three independent experiments (right panel; *p < 0.0374). (C) Mitochondrial membrane potential was evaluated by labeling cells with JC1 reagent and analyzing by flow cytometry at FL1 and FL2 channel. The ratio FL2 to FL1 (aggregate/monomer) was calculated and expressed as mean (± SEM) of four independent experiments (**p < 0.0014).

An official website of the United States government
Here's how you know
Official websites use .gov
A
.gov website belongs to an official
government organization in the United States.
Secure .gov websites use HTTPS
A lock (
) or https:// means you've safely
connected to the .gov website. Share sensitive
information only on official, secure websites.
