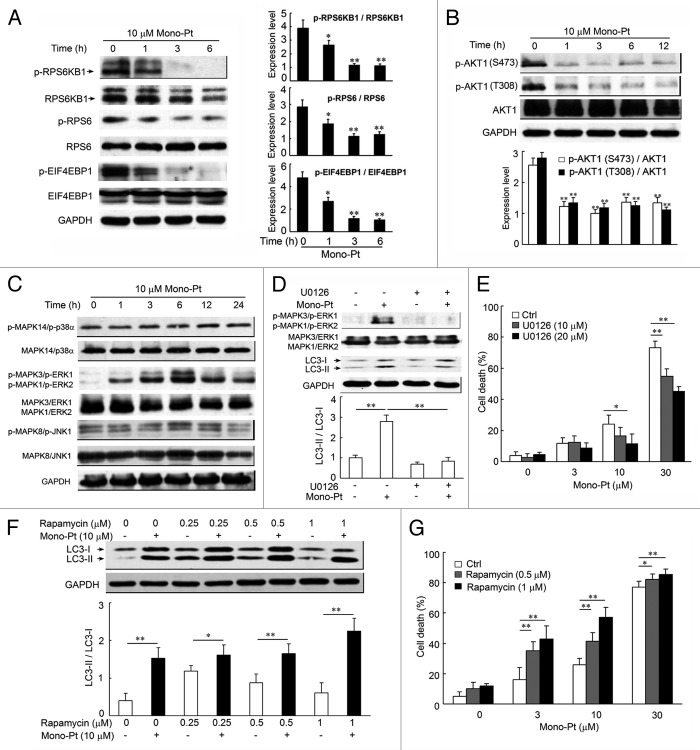
Figure 6. Mono-Pt induces autophagic cell death through AKT1-MTOR-RPS6KB1- and MAPK1/3-dependent signaling pathways. (A and B) Caov-3 cells treated with 10 μM Mono-Pt for various time-intervals were analyzed by western blot for phosphorylated and total RPS6KB1, RPS6, EIF4EBP1 (A), and AKT1 expression (B). Densitometry analysis was performed using three independent experiments. *p < 0.05, **p < 0.01, as compared with 0 h point. (C) Caov-3 cells with or without 10 μM Mono-Pt treatment for indicated times were analyzed by western blot for phosphorylated and total MAPK expression. The results shown are representative of three experiments. (D) Caov-3 cells treated with 10 μM Mono-Pt and/or U0126 for 6 h were analyzed by western blot using indicated antibodies. Densitometry analysis was performed using three independent experiments. (E) Caov-3 cells were treated with 0, 3, 10 or 30 μM Mono-Pt and/or 10 or 20 μM U0126 for 24 h. Cell death was measured by trypan blue exclusion assay. (F) Caov-3 cells treated with various concentrations of rapamycin and/or 10 μM Mono-Pt for 24 h were analyzed by western blot. Densitometry analysis was performed using three independent experiments. (G) Caov-3 cells were treated with 0, 3, 10 or 30 μM Mono-Pt and/or 0.5 or 1 μM rapamycin for 24 h. Cell death was measured by trypan blue dye exclusion assay. *p < 0.05, **p < 0.01.

An official website of the United States government
Here's how you know
Official websites use .gov
A
.gov website belongs to an official
government organization in the United States.
Secure .gov websites use HTTPS
A lock (
) or https:// means you've safely
connected to the .gov website. Share sensitive
information only on official, secure websites.
