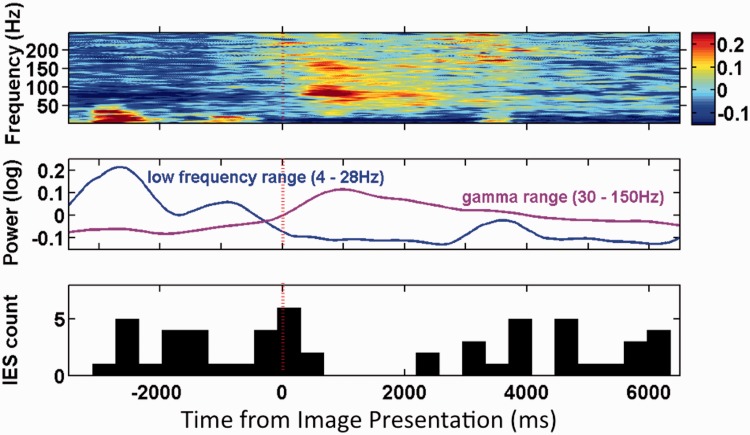
Figure 4.
Top: Multi-taper time-frequency spectrogram from Patient 6 during correct encoding in one hippocampal electrode (Talairach coordinates x = 25.62, y = −16.55, z = −18.94). Power is plotted per the adjacent colour bar in arbitarary units of normalized power. Middle: Instantaneous power plotted for low (4–28 Hz) and high frequency (30–150 Hz) bands showing the reciprocal changes between the two bands in the Period 1 period in this patient. Bottom: Total interictal epileptiform spike (IES) count during 400 ms windows. Total interictal epileptiform spike count declines through Period 1 and returns towards baseline in Period 3. Red dashed line indicates image presentation.

