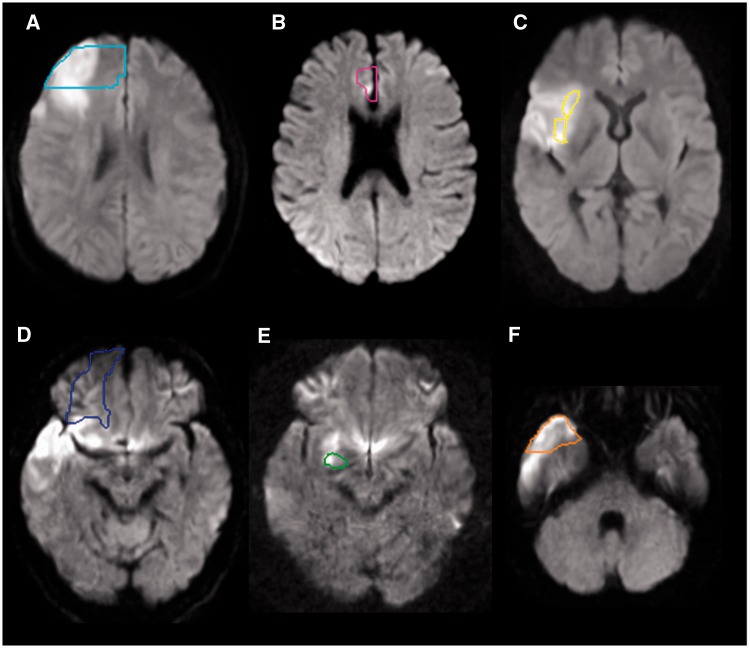
Figure 2.
Representative individuals with acute infarction in the prefrontal cortex (A, cyan contour), anterior cingulate cortex (B, pink contour), anterior insular cortex (C, yellow contour), orbitofrontal cortex (D, blue contour), amygdala (E, green contour) and the temporal pole (F, orange contour). Diffusion weighted images were normalized to the JHU-MNI atlas space and predefined regions of interest were overlaid on the normalized images. Images are all in radiological convention.

