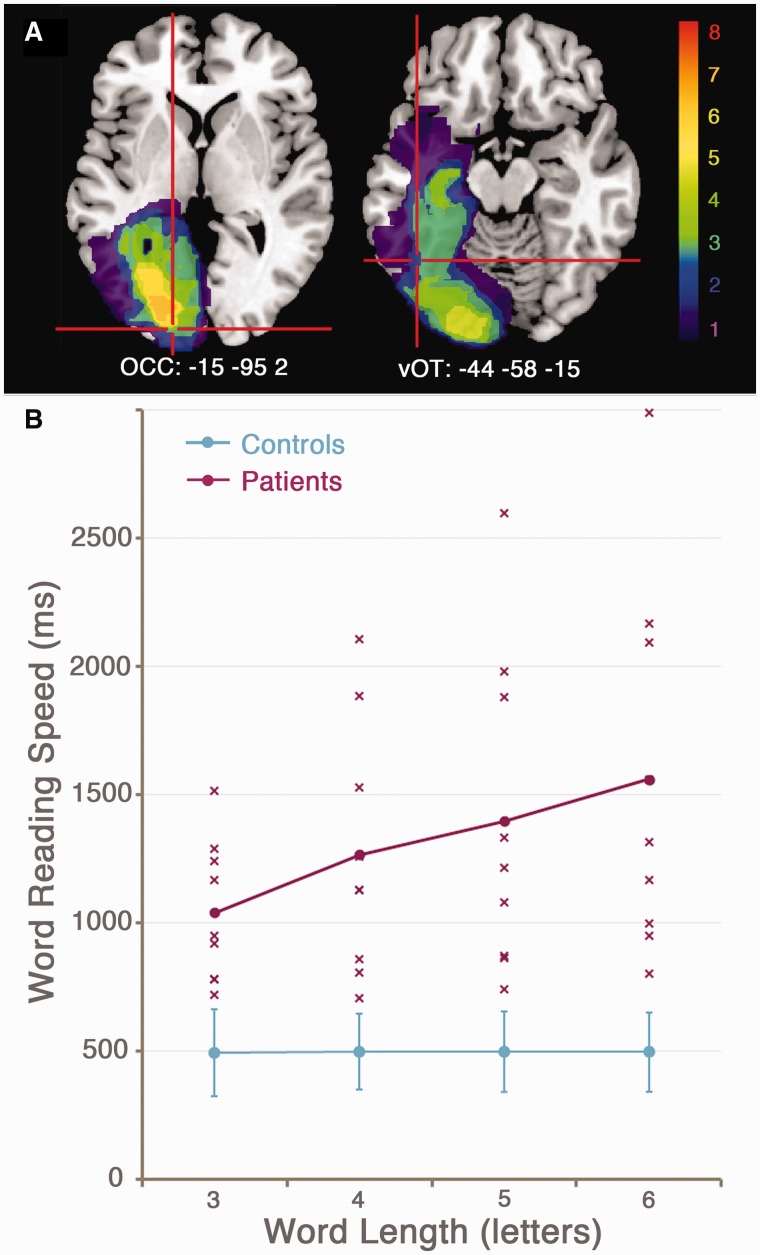
Figure 3.
(A) Lesion overlay map for the patient group, demonstrating the area of maximal overlap in occipital white matter of the left hemisphere. Crosshairs indicate the location of the left occipital (OCC) and ventral occipitotemporal (vOT) spatial priors for the source localization analysis (n = 8). (B) Reading speed slopes demonstrating the effect of word length (3–6 letters) on reading latency for the patient group (pink) and control group (blue). Each cross represents data from an individual patient.

