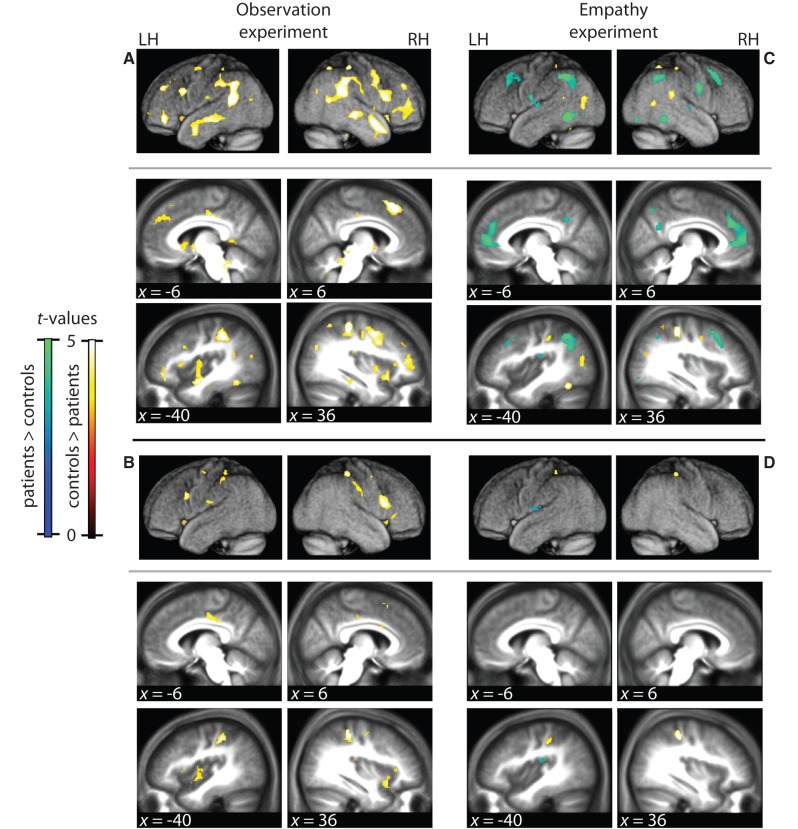
Figure 3.
Observation and empathy results. (A and B) Group differences during observation (Punc < 0.001,qfdr < 0.05) (Supplementary Table 3). (C and D) Group differences during empathy (Punc < 0.001, qfdr < 0.05) (Supplementary Table 4). (B and D) Same as A and C, but masked inclusively with the region of interest (Tables 2 and 3). Hot colours: BOLD response control > psychopaths; cold colours: psychopaths > controls. RH = right hemisphere; LH = left hemisphere; x = MNI coordinate of sagittal plane. Slices and renders are taken from the mean normalized anatomy of all subjects.

