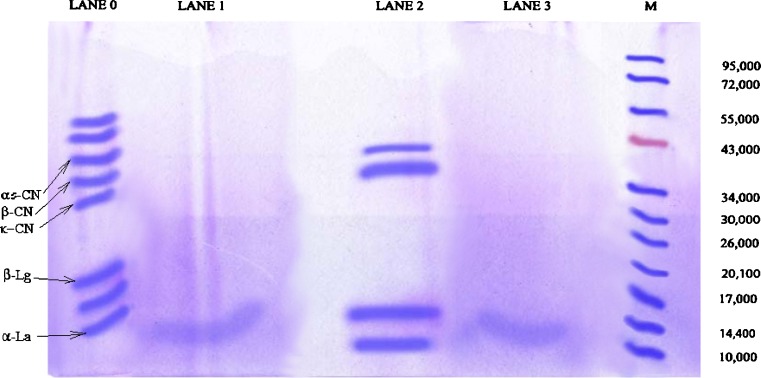
Fig. 2.
SDS-PAGE analysis of curd proteins. Lane M, protein markers with standard molecular weight ranged from 10 to 95 kDa; Lane 0, soy (whey) protein, Lane 1 soy curd protein, Lane 2, cow milk (whey) protein, and Lane 3, cow milk curd protein. The SDS-electrophoretic profile of the milk proteins (lane 0) contains five major bands identified as α s–casein, ß-casein, α –La, 71 kDa-band, and three minor bands identified as β-Lg, κ-casein

