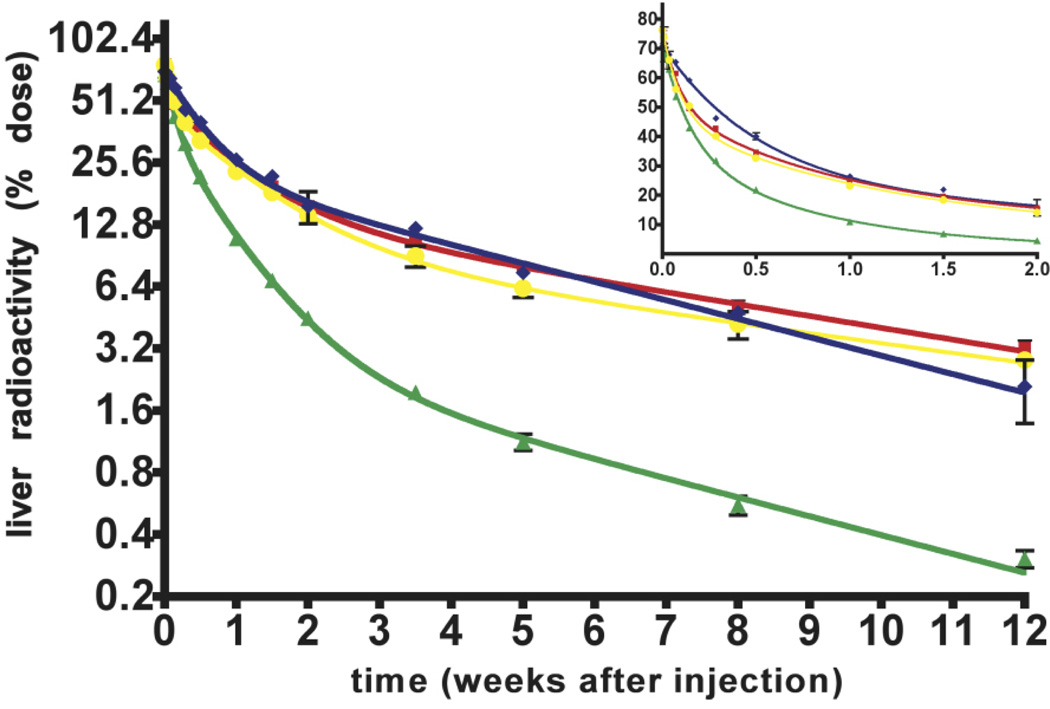
Figure 2. 14C-AGE hepatic disposal following uptake of injected 14C-AGE-BSA.
The fate of the 14C-AGE tracer in the liver of pre-pubertal (green triangles), young-adult (red squares), middle age (yellow rings) and old (blue diamonds) mice was followed for 12 weeks after intravenous injection of 14C-AGE-BSA (4.7 µg, 2×10⁶ dpm).
Radioactivity retained in liver is given as percentage of injected radioactivity (% dose) and is plotted in a semi-logarithmic plot (log2-linear scale) up to 12 weeks after injection. The insert represents the linear plot (linear - linear scale) of the data up to 2 weeks after ligand administration. Mean ± SD shown (n < 6 per time point).
Each age group liver radioactivity-time profile was fitted to either 2-or 3-phase exponential models to describe the time course of liver radioactivity. These models have the mathematical form of A = C1.e−k1*t+C2.e−k2*t+C3.e−k3*t where A is the 14C-AGE-associated radioactivity in liver (expressed as % dose), C is the coefficient from the exponential model, k is the exponent and t is time after injection (weeks). Half-life is calculated as ln2/k. The subscripts 1, 2 and 3 refer to the initial, intermediate and terminal phases respectively. The AUC from each phase is calculated as C/k and the total AUC is the sum of the AUC for each phase. Curves are built from parameters obtained by fitting two-phase exponential decay (old group) and three phase exponential decay (pre-pubertal, young-adult, middle-aged groups) models to the data points. The model that best described the radioactivity disposal data was selected using the Akaike's Information Criterion (AIC).

