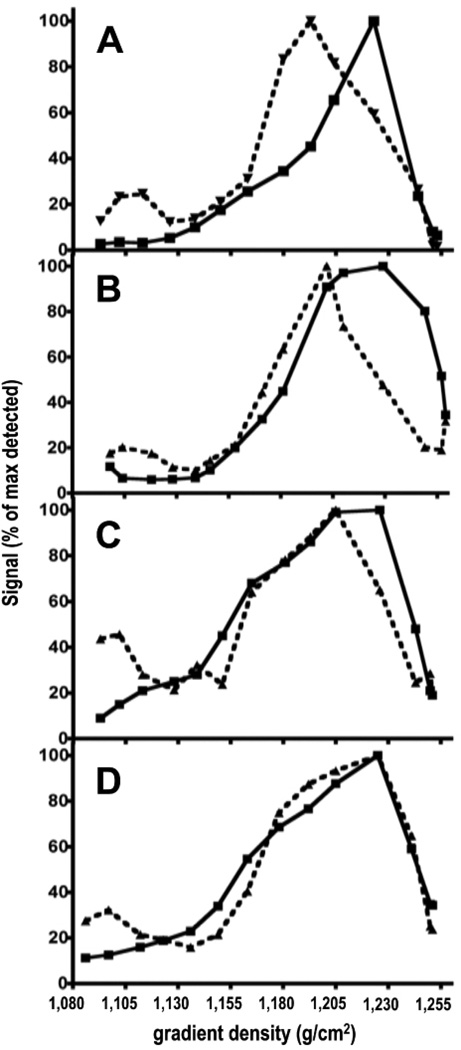
Figure 4. Subcellular localization of 14C-AGEs.
14C-AGE-BSA (4.7 µg, 2×10⁶ dpm) was injected intravenously in pre-pubertal (A), young-adult (B), middle-aged (C) and old (D) mice. Livers were resected, homogenized, and cellular compartments were separated on linear sucrose gradient 5 weeks after 14C-AGE-BSA injection. Radioactivity and acid DNAse (a lysosomal marker (De Leeuw et al., 1990)) activity were measured in the sucrose gradient fractions.
Acid DNAse indicates the location of lysosomes on the gradient. About 50% of this enzyme comes from KCs and LSECs and the rest originates from PCs (Wattiaux et al., 1993). Lysosomes from all the three cell types normally banded at the same density on sucrose gradient (Wattiaux et al., 1993).
All radioactive material in the gradient originates from KCs and LSECs.
Results are presented as % of maximum detected radioactivity (squares, solid line) and % of maximum detected acid DNase activity (triangles, dashed line) in the fractions as a function of the gradient density.
A- pre-pubertal; B- young-adult; C- middle-age and D- old-age groups.
The radioactivity peak banded at virtually the same sucrose gradient density 1.223–1.229g/ml in all age groups (panels A–D). Acid DNAse peak banded at density 1.193; 1.202; 1.205 and 1.225g/ml in pre-pubertal; young-adult; middle-age and old-age groups respectively (panels A–D).

