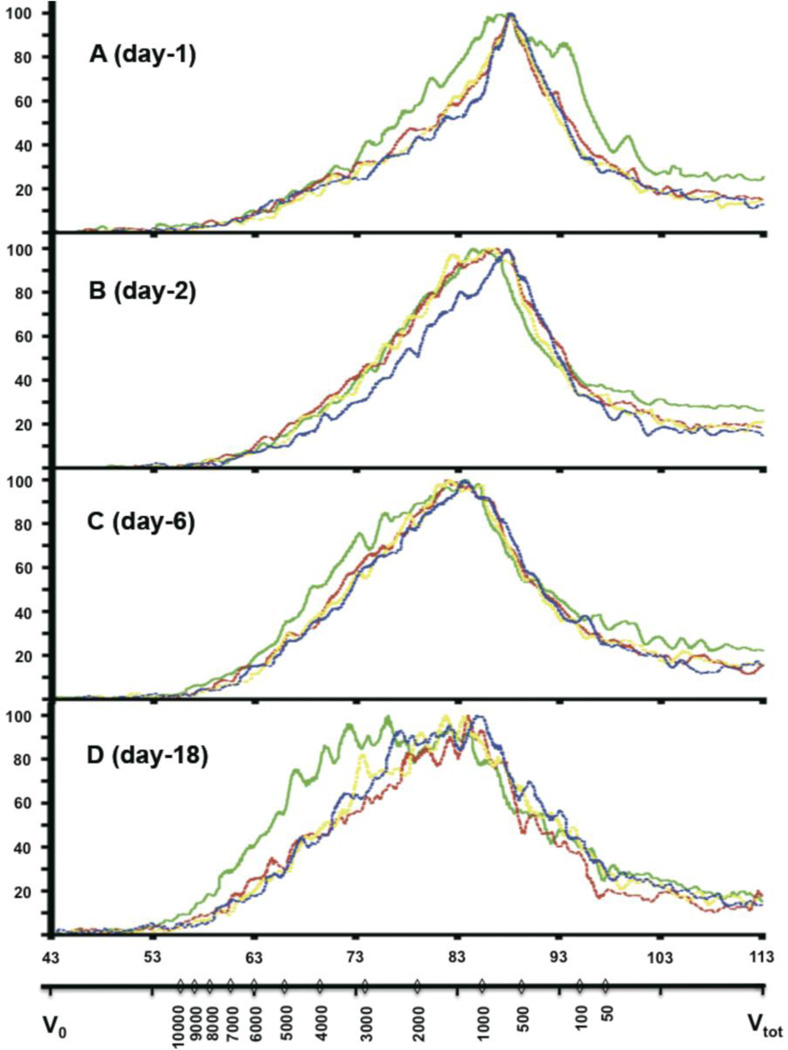
Figure 5. Size distribution of 14C-AGE-DPs in urine.
Urine samples were collected 1 day (A), 2 days (B), 6 days (C) and 18 days (D) after intravenous injection of 14C-AGE-BSA (4.7 µg, 2×10⁶ dpm, per animal).
Size distribution of urinary 14C-AGE-DPs from pre-pubertal (n=4, green line), young-adult (n=2, red line), middle-aged (n=2, yellow line) and old (n=l, blue line) mice was performed by size exclusion chromatography using Superdex peptide 10/300 GL column. MW was calculated from the standard curve generated by plotting the retention time of standards against their corresponding MW. Results presented are representative chromatograms of one animal per age group at the different time points.
The two x-axes represent MW distribution (Da, lower x-axis) and retention time (min, upper x-axis). Signal intensity is expressed as 14C radioactivity (% of maximum detected) is plotted along the y-axis. Vo - void volume of the column; Vtot - total volume of the column.

