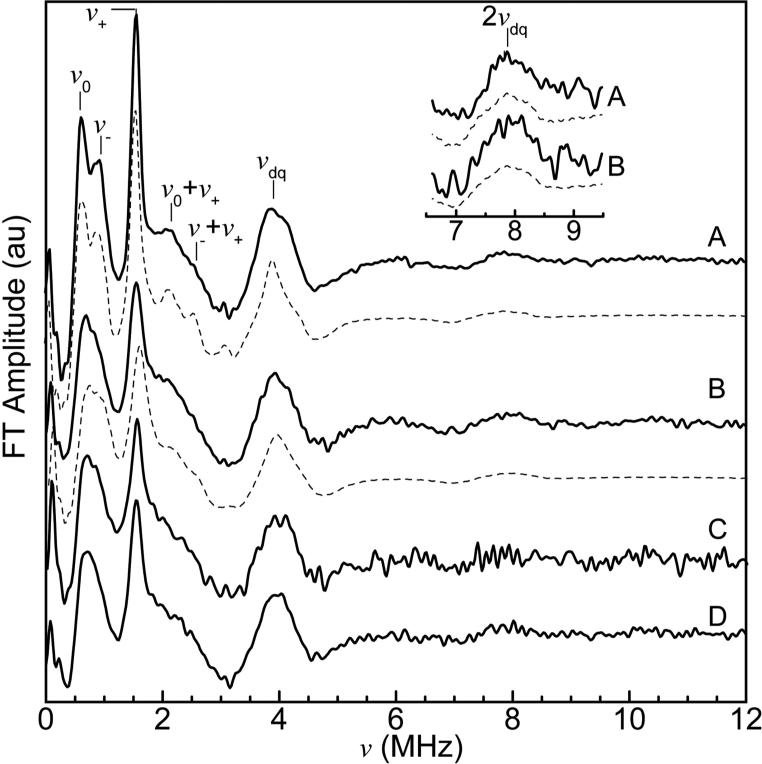
Figure 3.
FT spectra of the three-pulse ESEEM waveforms of Cu2+-Aβ complexes. (A) Soluble Cu2+-Aβ(1-16), experiment and simulation (dashed line), (B) Fibrillar Cu2+-Aβ(1-40), experiment and simulation (dashed line), (C) 13C,15N-His13-Cu2+-Aβ(1-40), (D) 13C,15N-His14-Cu2+-Aβ(1-40). Inset: Expanded view of double quantum harmonic region, for (A) soluble Cu2+-Aβ(1-16) and (B) fibrillar Cu2+-Aβ(1-40). Acquisition Parameters: microwave frequency, 8.750 GHz, B0 = 303 mT, T = 6 K, τ = 310 ns. Spectrum A is an average of 10 scans, spectrum B is an average of 16 scans, and spectra C and D are an average of 25 scans. Simulation parameters for spectra A and B are presented in Table 2.

