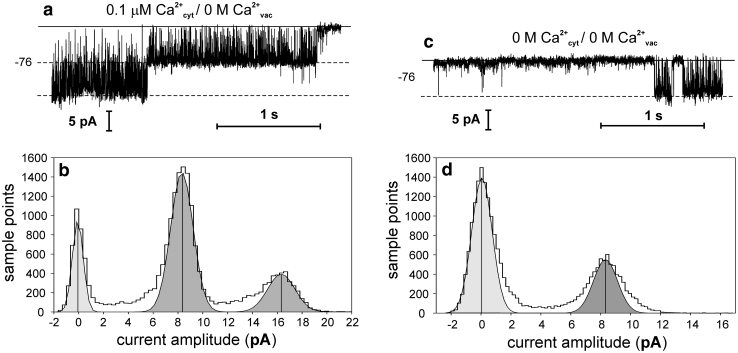
Fig. 5.
Influence of cytoplasmic calcium on the K+-selective channel activity. The records were obtained in the cytoplasm-out configuration at −76 mV. a Channel activity recorded at 0.1 μM CaCl2, 100 mM NaCl, 15 mM HEPES/Tris, pH 7 in the medium and 2 mM EGTA, 100 mM KCl, 15 mM MES/Tris, pH 5.8 in the pipette. b Histogram based on four records as in a. c Channel activity recorded at 2 mM EGTA, 100 mM NaCl, 15 mM HEPES/Tris, pH 7 in the medium and 2 mM EGTA, 100 mM KCl, 15 mM MES/Tris, pH 5.8 in the pipette. d Histogram based on four records as in c

