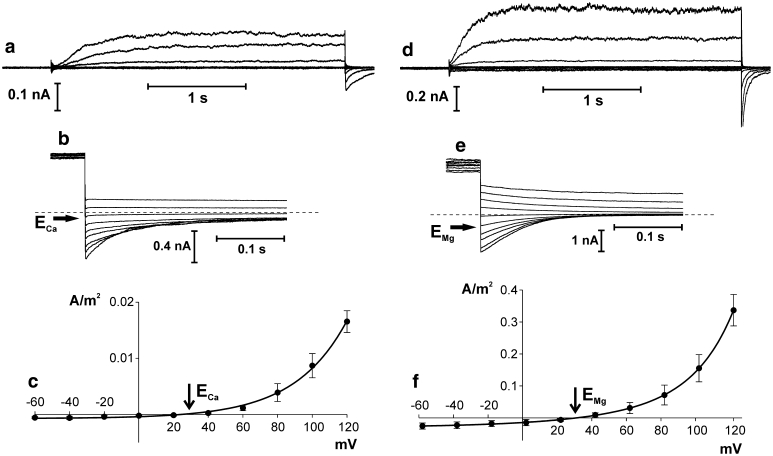
Fig. 6.
Ion channel activity recorded in Physcomitrella patens vacuoles when the currents were carried by Ca2+ (a–c) and Mg2+ (d–f). a Whole-vacuole currents recorded at 1 mM CaCl2, 15 mM HEPES/Tris, pH 7 in the medium and 10 mM CaCl2, 15 mM MES/Tris, pH 5.8 in the pipette. b Tail currents recorded at 5 mM CaCl2, 15 mM HEPES/Tris, pH 7 in the medium and 50 mM CaCl2, 15 mM MES/Tris, pH 5.8 in the pipette. Holding voltage (100 mV) lasted 2 s and then test voltages from −30 to 50 mV with 10 mV steps were applied. Dashed line indicates zero current. Horizontal arrow points to the reversal potential. c J–V curve obtained in the same conditions as in a (solid line and closed circles, n = 4). d Whole-vacuole currents recorded at 10 mM MgCl2, 15 mM HEPES/Tris, pH 7 in the medium and 100 mM MgCl2, 15 mM MES/Tris, pH 5.8 in the pipette. e Tail currents recorded in the same conditions as in d. Holding voltage (102 mV) lasted 2 s and then test voltages from −8 to 82 mV with 10 mV steps were applied. Dashed line indicates zero current. Horizontal arrow points to the reversal potential. f J–V curve obtained in the same conditions as in d (n = 7) (n denotes different vacuoles). Whole-vacuole recordings were obtained by application of 0.5 s holding voltage (20 mV for a, and 22 mV for d), then 3 s test voltages with 20 mV steps (from 120 to −60 mV for a and from 122 to −58 mV for d), and 0.3 s pulse (20 mV for a and 22 mV for d) after test voltage

