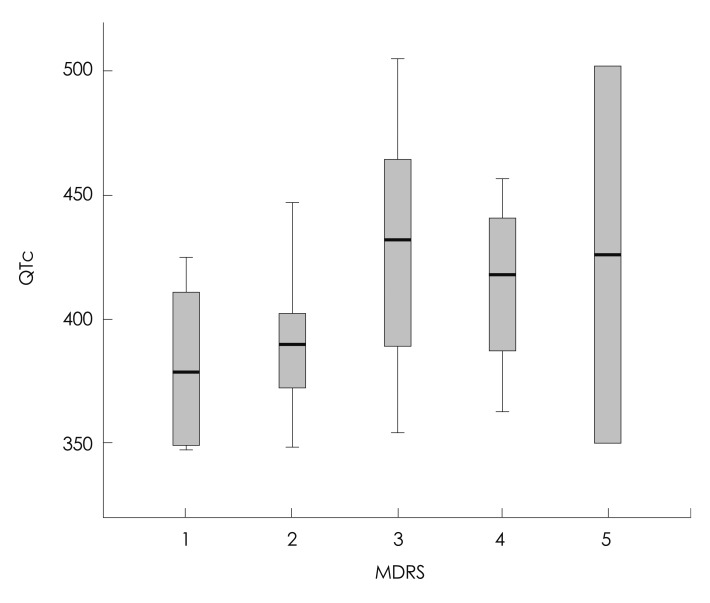
Fig. 1.
Corrected QT (QTc) interval in myotonic dystrophy type 1 according to the muscular disability rating scale (MDRS) score. In the box plots, the central line represents the median value (Kruskal-Wallis test, p=0.245), each box spans from the 25th to 75th percentiles, and error bars extend from the 10th to 90th percentiles.

