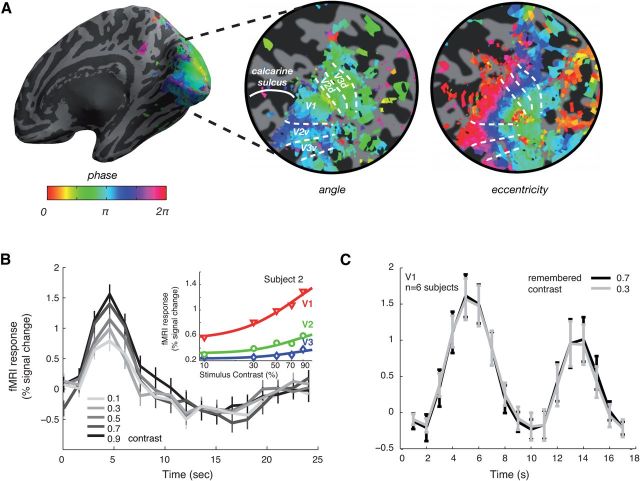
Figure 2.
Retinotopic mapping and event-related responses in early visual cortex. A, Example retinotopic maps from one subject. Information from visual angle and eccentricity measurements were used to define V1, V2 (ventral + dorsal), and V3 (ventral + dorsal). B, Event-related fMRI responses as a function of visual stimulus contrast in V1 of one subject. Gray lines indicate the estimated event-related responses for low (light-gray) to high (dark gray) contrast. Error bars indicate SEM across trials. Inset: fMRI contrast-response curves in V1 (red), V2 (green), and V3 (blue) for this subject; symbols, amplitude of measured fMRI response; lines, nonlinear least-squares fit to data (Naka-Rushton). C, Event-related responses from the working memory experiment. Plot shows average responses in V1 during trials in which the remembered contrasts were 0.3 and 0.7, respectively (mean ± SEM across subjects). The curves show a typical pattern of response with a large transient after the presentation of the two stimuli and cue at fixation at the beginning of each trial, followed by a reduced response during the delay period and another transient increase in response after the presentation of the comparison stimulus.

