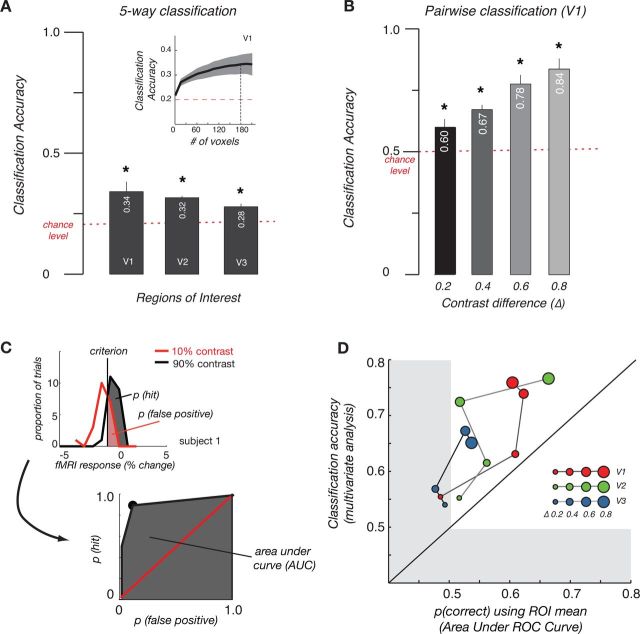
Figure 3.
A, Five-way classification for perceived contrast data across different ROIs. Plots show mean ± 1 SEM across subjects. The dashed line indicates the classification accuracy for n = 180 voxels, the lowest common number of voxels available across ROIs and subjects rounded down to a multiple of 10. B, Pairwise classification based on the difference of contrast levels in V1 averaged across subjects. Error bars indicate SEM across subjects. Colors indicate various contrast differences. C, Illustration of ROC and measured area under curve (AUC) for pairwise classification. Top left: Distributions for fMRI response to 10% (red curve) and 90% (black curve) contrast. Vertical line corresponds to the criterion used for classification of trials of two contrast levels. Trials on the right of this line were labeled as 90% contrast, within which trials classified as high contrast was referred as hits (gray area). Because the curves overlap, some trials corresponding to 10% contrast were also greater than the criterion and labeled incorrectly as 90% contrast, thus contributing to the proportion of false positives (red area). Bottom right: ROC curve is plotted with the false-positive rates on the x-axis and the hit rates on the y-axis with different criteria. Black dot corresponds to the criterion shown in the upper graph. Red line indicates the chance performance of classification for 10% and 90% contrast. Gray area indicates the area under ROC curve. D, Comparison between proportion correct for pairwise discrimination using only the mean response (area under ROC curve obtained using signal detection theory with the method illustrated in Fig. 3C) and classification accuracy from multivariate analysis in different ROIs. Size of symbols indicates all pairwise comparisons of trials with a given difference in contrast. Color of symbols indicates the ROI used in the analysis. Diagonal line illustrates equivalence of multivariate classification and classification on the mean response in the ROI. Shaded area indicates the cutoff for chance level (50%) performance.

